11,000 people starred a fix for AI-looking design. I tested it. Looking like AI wasn't the problem.

AI-made isn't the same as bad. The chart fill and the big weather icon it took out were the parts I read fastest.


A free AI skill that strips the "made by AI" look out of web pages collected 11,158 stars on GitHub in its first nine days. I ran it on four pages, one of them AI-made on purpose, and had three judges pick between the before and after without knowing which was which. It spots the AI look precisely. Then it removes things that were working.

007Field ReportNov 07, 2026Revision 2Independent research →PDF ↓

Instrument and questions: Rick Worthington
Analysis and prose: Earl (Claude Opus 5.5), under Rick Worthington's editorial direction

Watch the video at lab.worthington.cloud/entries/ai-looking-design-tested

The claim

If a web page looks like an AI made it, is it bad?

There's a word going around for AI-made design: slop. You know it when you see it. Purple-to-blue gradients, glowing buttons, an emoji in front of every label, headings in spaced-out capitals, and a little sparkle on anything that touches AI.

On Oct 29, a designer named Damir Sokolovsky published unslop, a free skill for Claude Code and Codex: a set of instructions an AI coding agent follows. It promises to turn "vibecoded, AI-looking UI into a designed interface."[1] Vibecoded means built fast by an AI from a loose description. By Nov 7 it had 11,158 stars on GitHub, the site's bookmark that doubles as a popularity count.[2] My research instrument flagged it as one of the week's fastest risers.

The skill is one long instruction file plus two small helper scripts. It reads a page, lists every sign of the AI look and where each one lives, proposes a design direction, and stops to ask you before it changes anything. Then it works through nine passes in a fixed order: spacing, color, icons, copy, type, layout, details, visuals, motion.

I wanted to know two things. Does it make pages better? And does it know when to leave a page alone?

What held up

“Spot the AI look, precisely.”

Held up

64 findings, each on its element

moderateFinding 1 →

“Make an AI-made page better.”

Split

2 AI judges yes the human judge no

Invented pagemodeledFinding 2 →

“Leave a good page alone.”

Failed

3 of 3 judges preferred the untouched original

Real pagemoderateFinding 3 →

“Never invent data or features.”

Held up

It asked instead, every time.

moderateFinding 1 →

In one breath: it finds the AI look precisely, and it treats "looks AI-made" and "is bad" as one claim. They're two.

The four pages

I picked four pages, each there for a reason:

  1. A weather station dashboard, AI-made on purpose

    I asked Claude Haiku 5.5, the cheapest Claude model, for "a dashboard for my home weather station" that would "look modern and impressive," with no style rules. It's an invented station with invented readings. This is the page the tool was built for.

  2. My research console

    The private site where the claims behind these reports live. Built by AI, under house rules.

  3. My Lab traffic dashboard

    A page of visitor counts built with care. It's the control, the page that should pass.

  4. The Lab's homepage

    I told the tool the red accent was an early decision and I was open to a new style.

Part A: Spotting the AI look

f1modeledThe invented page, made by a model on purpose

It sees the AI look the way a designer does

Invented pageIt found 26 problems on the AI-made page, each pinned to the element it lives on, and asked instead of guessing when the page's own data disagreed.

Measured on an invented pageA page a model made up on purpose
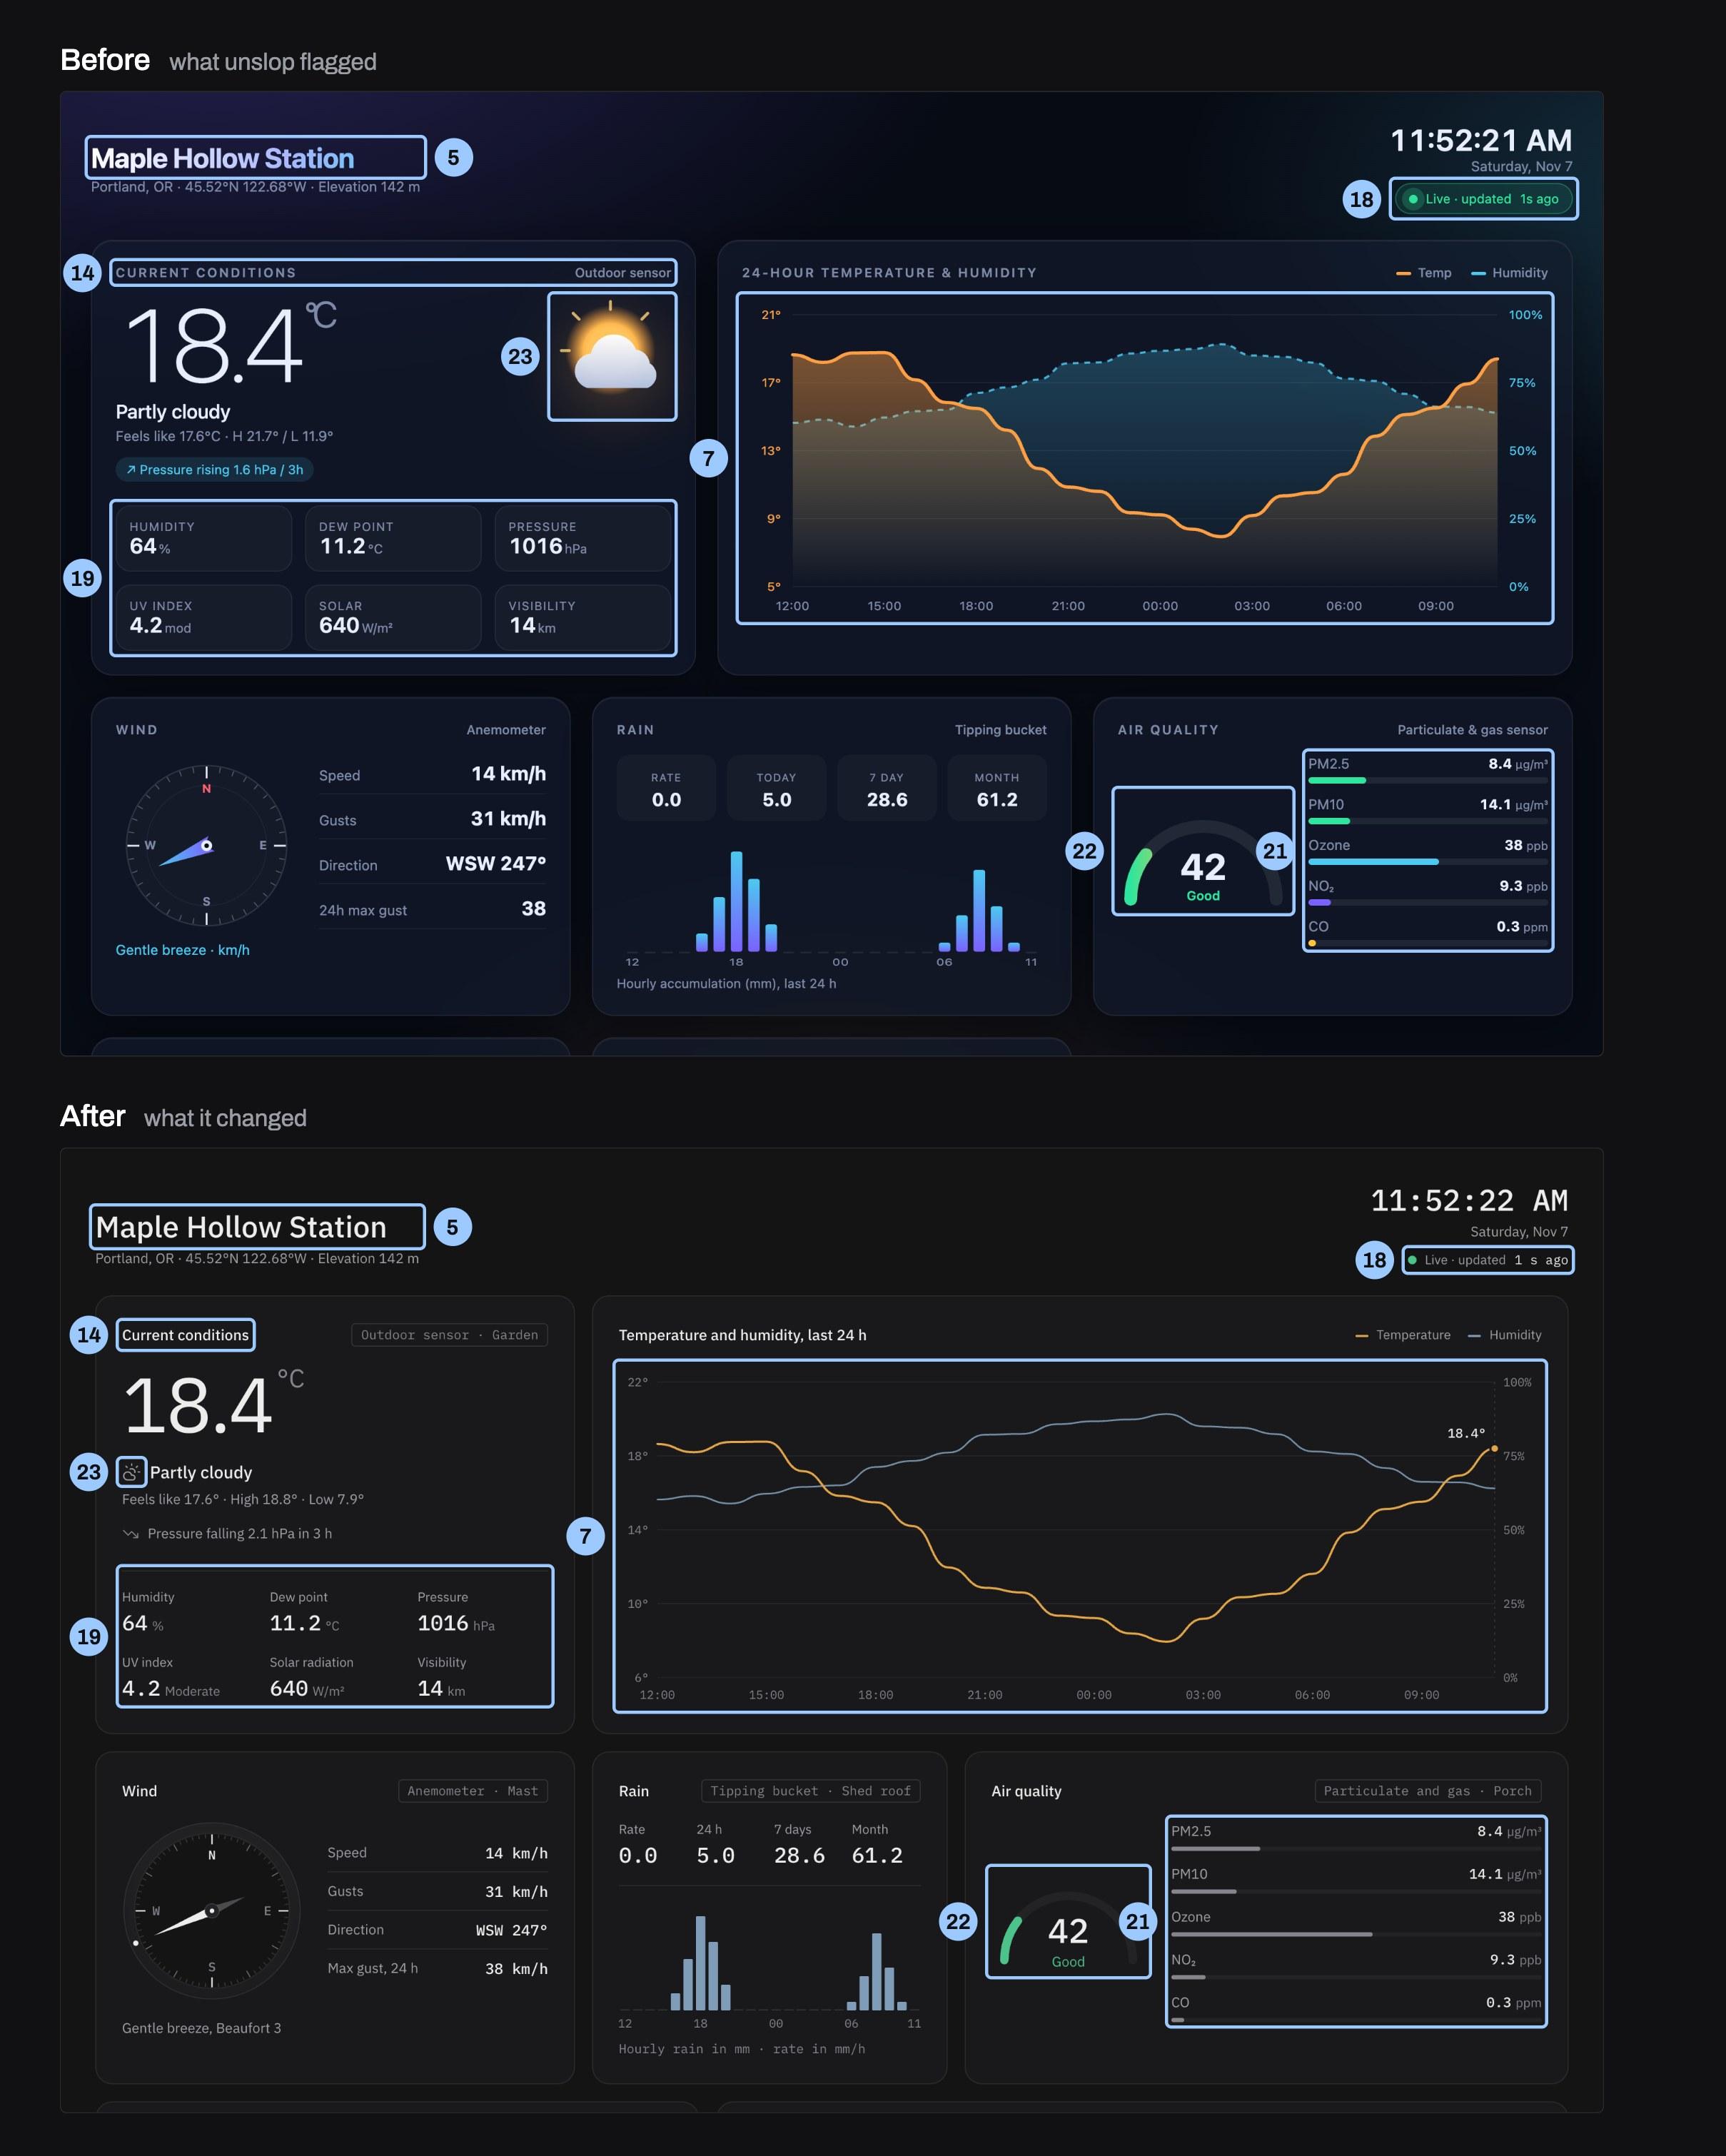
The weather station dashboard twice, before above and after below. Before: a dark purple page with the station name in gradient text, a glossy sun and cloud icon, a temperature and humidity chart with overlapping filled washes, rainbow air-quality bars and a rainbow gauge. After: plain gray panels, the name in solid off-white, a small line icon beside Partly cloudy, one amber temperature line and a thin slate humidity line, and gray pollutant bars. Numbered light-blue boxes mark the same elements in both.
  • 5Gradient text on the name. The station name faded from white to lavender to cyan, the most common AI tell. The name is solid off-white text at 28px weight 500.
  • 7Muddy overlapping chart fills. Both chart lines had filled color washes that overlapped into brown and teal, with axis labels in two colors. Temperature is one amber line with today's reading marked, humidity a thin slate line, and the axis labels are muted.
  • 14Uppercase tracked card titles. Every card title and small label was in spaced-out capitals. Titles and labels are in sentence case at normal spacing.
  • 18Glowing live pill. The live status sat in a green glowing pill with a pulsing halo. Live status is quiet text with a small steady green dot.
  • 19Boxes inside boxes. Six readings each sat in their own bordered box inside the card. The readings form an open grid under one hairline, with no inner boxes.
  • 21Rainbow pollutant bars. Each pollutant bar had its own color, green, cyan, violet or yellow, for no reason. All pollutant bars are one gray, so the length is what you read.
  • 22Rainbow air-quality gauge. The air-quality arc ran a green-to-red rainbow and the number was in heavy bold. The arc is a gray track filled in one green for 'Good', with the 42 in the mono face.
  • 23Glossy glowing sun clip-art. A glossy sun and cloud with an orange glow was the biggest picture on the card. A small line icon sits beside 'Partly cloudy', so the 18.4° reading leads.
The weather station dashboard, before (top) and after (bottom). The station and its readings are invented: a model made this page on purpose. Each numbered box sits on the element the finding was pinned to. Redline style adapted from unslop.
For whoever runs it: Use the list of findings as an audit. Each one names a sign and the exact element it's on, and that list is the part worth keeping.

On the weather page it found 26 problems, and each one was pinned to the exact element: the station name in gradient text, three color washes behind the page, glowing pills, six font weights on one screen, emoji as alert icons, cards inside cards, a rainbow on the air-quality gauge.

It also caught a problem in the data itself. The AI's invented data disagreed with itself. One card said the air pressure was rising, and an alert on the same page said it was falling. The high and low didn't match the chart. One sensor had two names. The tool didn't guess which was right. It asked me, I said to use the chart as the source, and it made them agree.

Its redesign reads like a real instrument: plain gray panels, one amber line for temperature, a compass drawn like a dial, and a small tag on each panel naming the sensor and where it's mounted ("Tipping bucket · Shed roof").

Both AI judges picked it, 4 out of 5 against 2 out of 5 for the original.
Part B: Looking AI-made

f2modeledThe invented page; one human judge

Looking AI-made isn't the same as bad

Invented pageThe only human judge picked the original, for the two things the tool took out: the fill under the chart and the big weather icon.

Measured on an invented pageA page a model made up on purpose

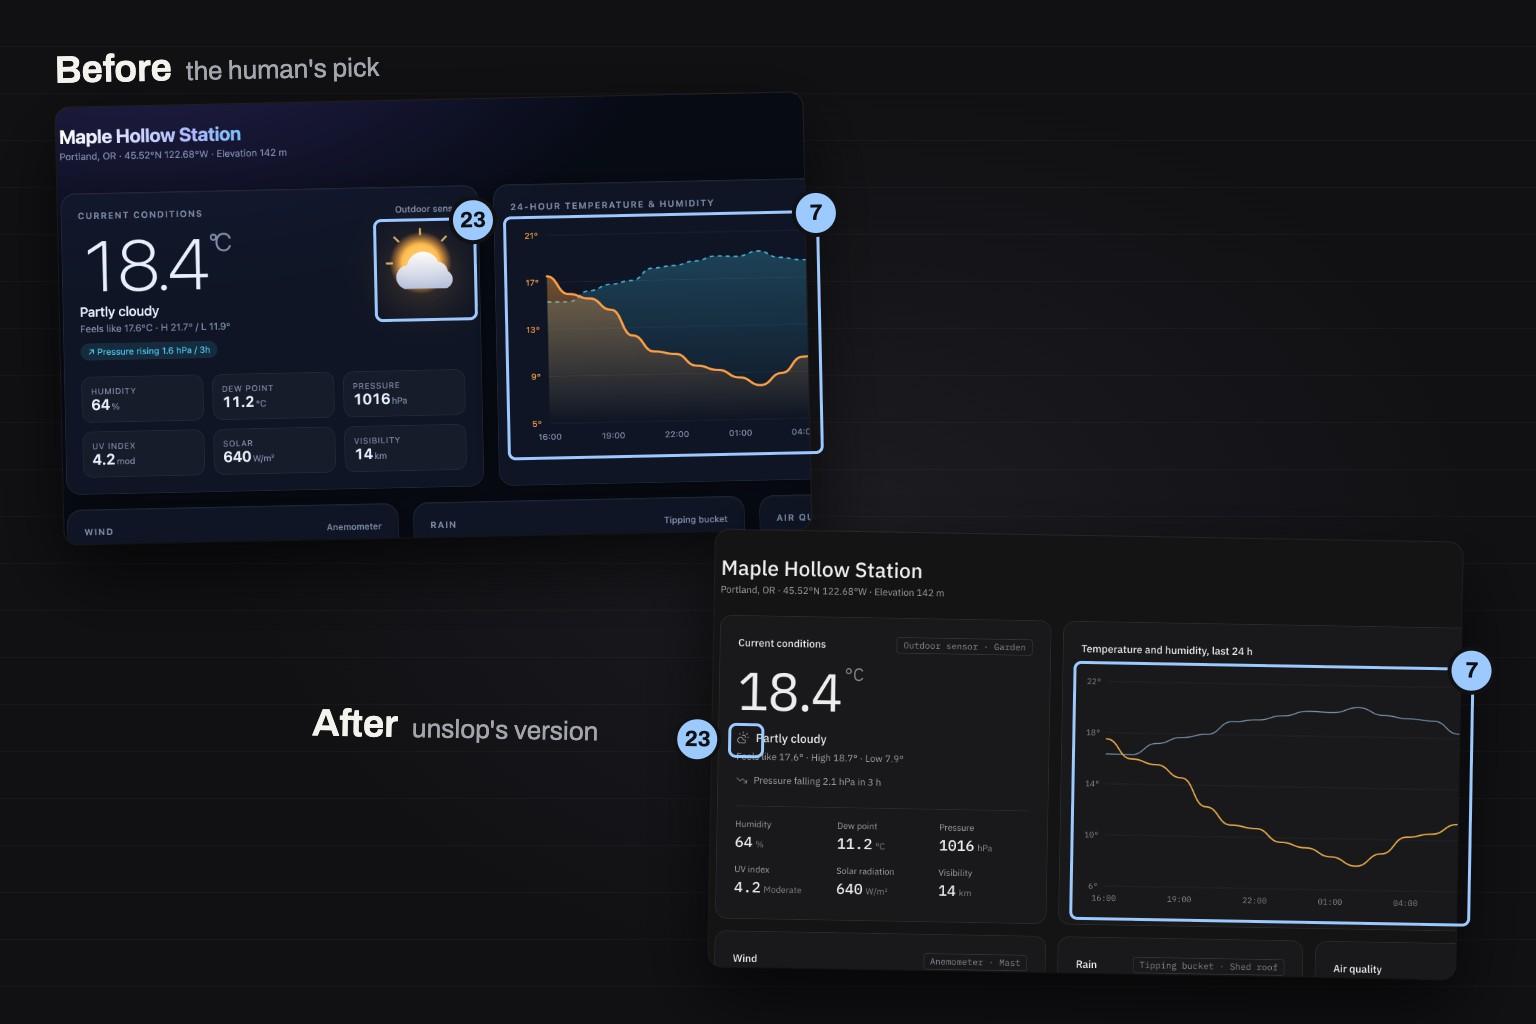
The weather dashboard twice, overlapping. Above, the original the human judge picked: a glossy sun and cloud icon, boxed and numbered 23, and a chart with shaded orange and blue fills under its lines, boxed and numbered 7. Below, unslop's version: a small line icon beside Partly cloudy, numbered 23, and the same chart as two thin lines with no fill, numbered 7.
The two things the human judge read fastest, and what unslop did to them: 23, the weather icon, shrunk to a line icon; 7, the fill under the chart, removed. Numbers match the first figure.
For whoever runs it: Before you accept a fix, ask whether it makes the data faster to read. If the AI-looking version reads faster, keep it.

I picked the original.

I didn't like the purple, and I could tell at a glance an AI had made it. But it popped more. The chart had a gradient fill under the line that made it richer to look at. The data was easier to take in. And the big cartoon sun told me the weather faster than the redesign, which shrinks it to a small line icon beside "Partly cloudy."

Those two things, the fill under the chart and the weather icon, are callouts 7 and 23 in the figure. They're exactly what the tool labeled as slop and removed: "muddy overlapping chart fills" and "glossy glowing sun clip-art."

The tool's instructions are a list of the common looks of AI-made pages. It can't tell when that look is doing a job. A gradient under a line makes the area under it read as a quantity. A weather icon is faster than the word. These show up on AI-made pages for the same reason they show up everywhere else: they work.

It might be common for a reason because it's commonly good.

Part C: Knowing when to stop

f3moderateThe control page; three judges

It doesn't know when to stop

Real pageOn the page that should have passed, it made 17 changes, and all three judges preferred the untouched original.

Measured on a real pageFrom the test's own runs

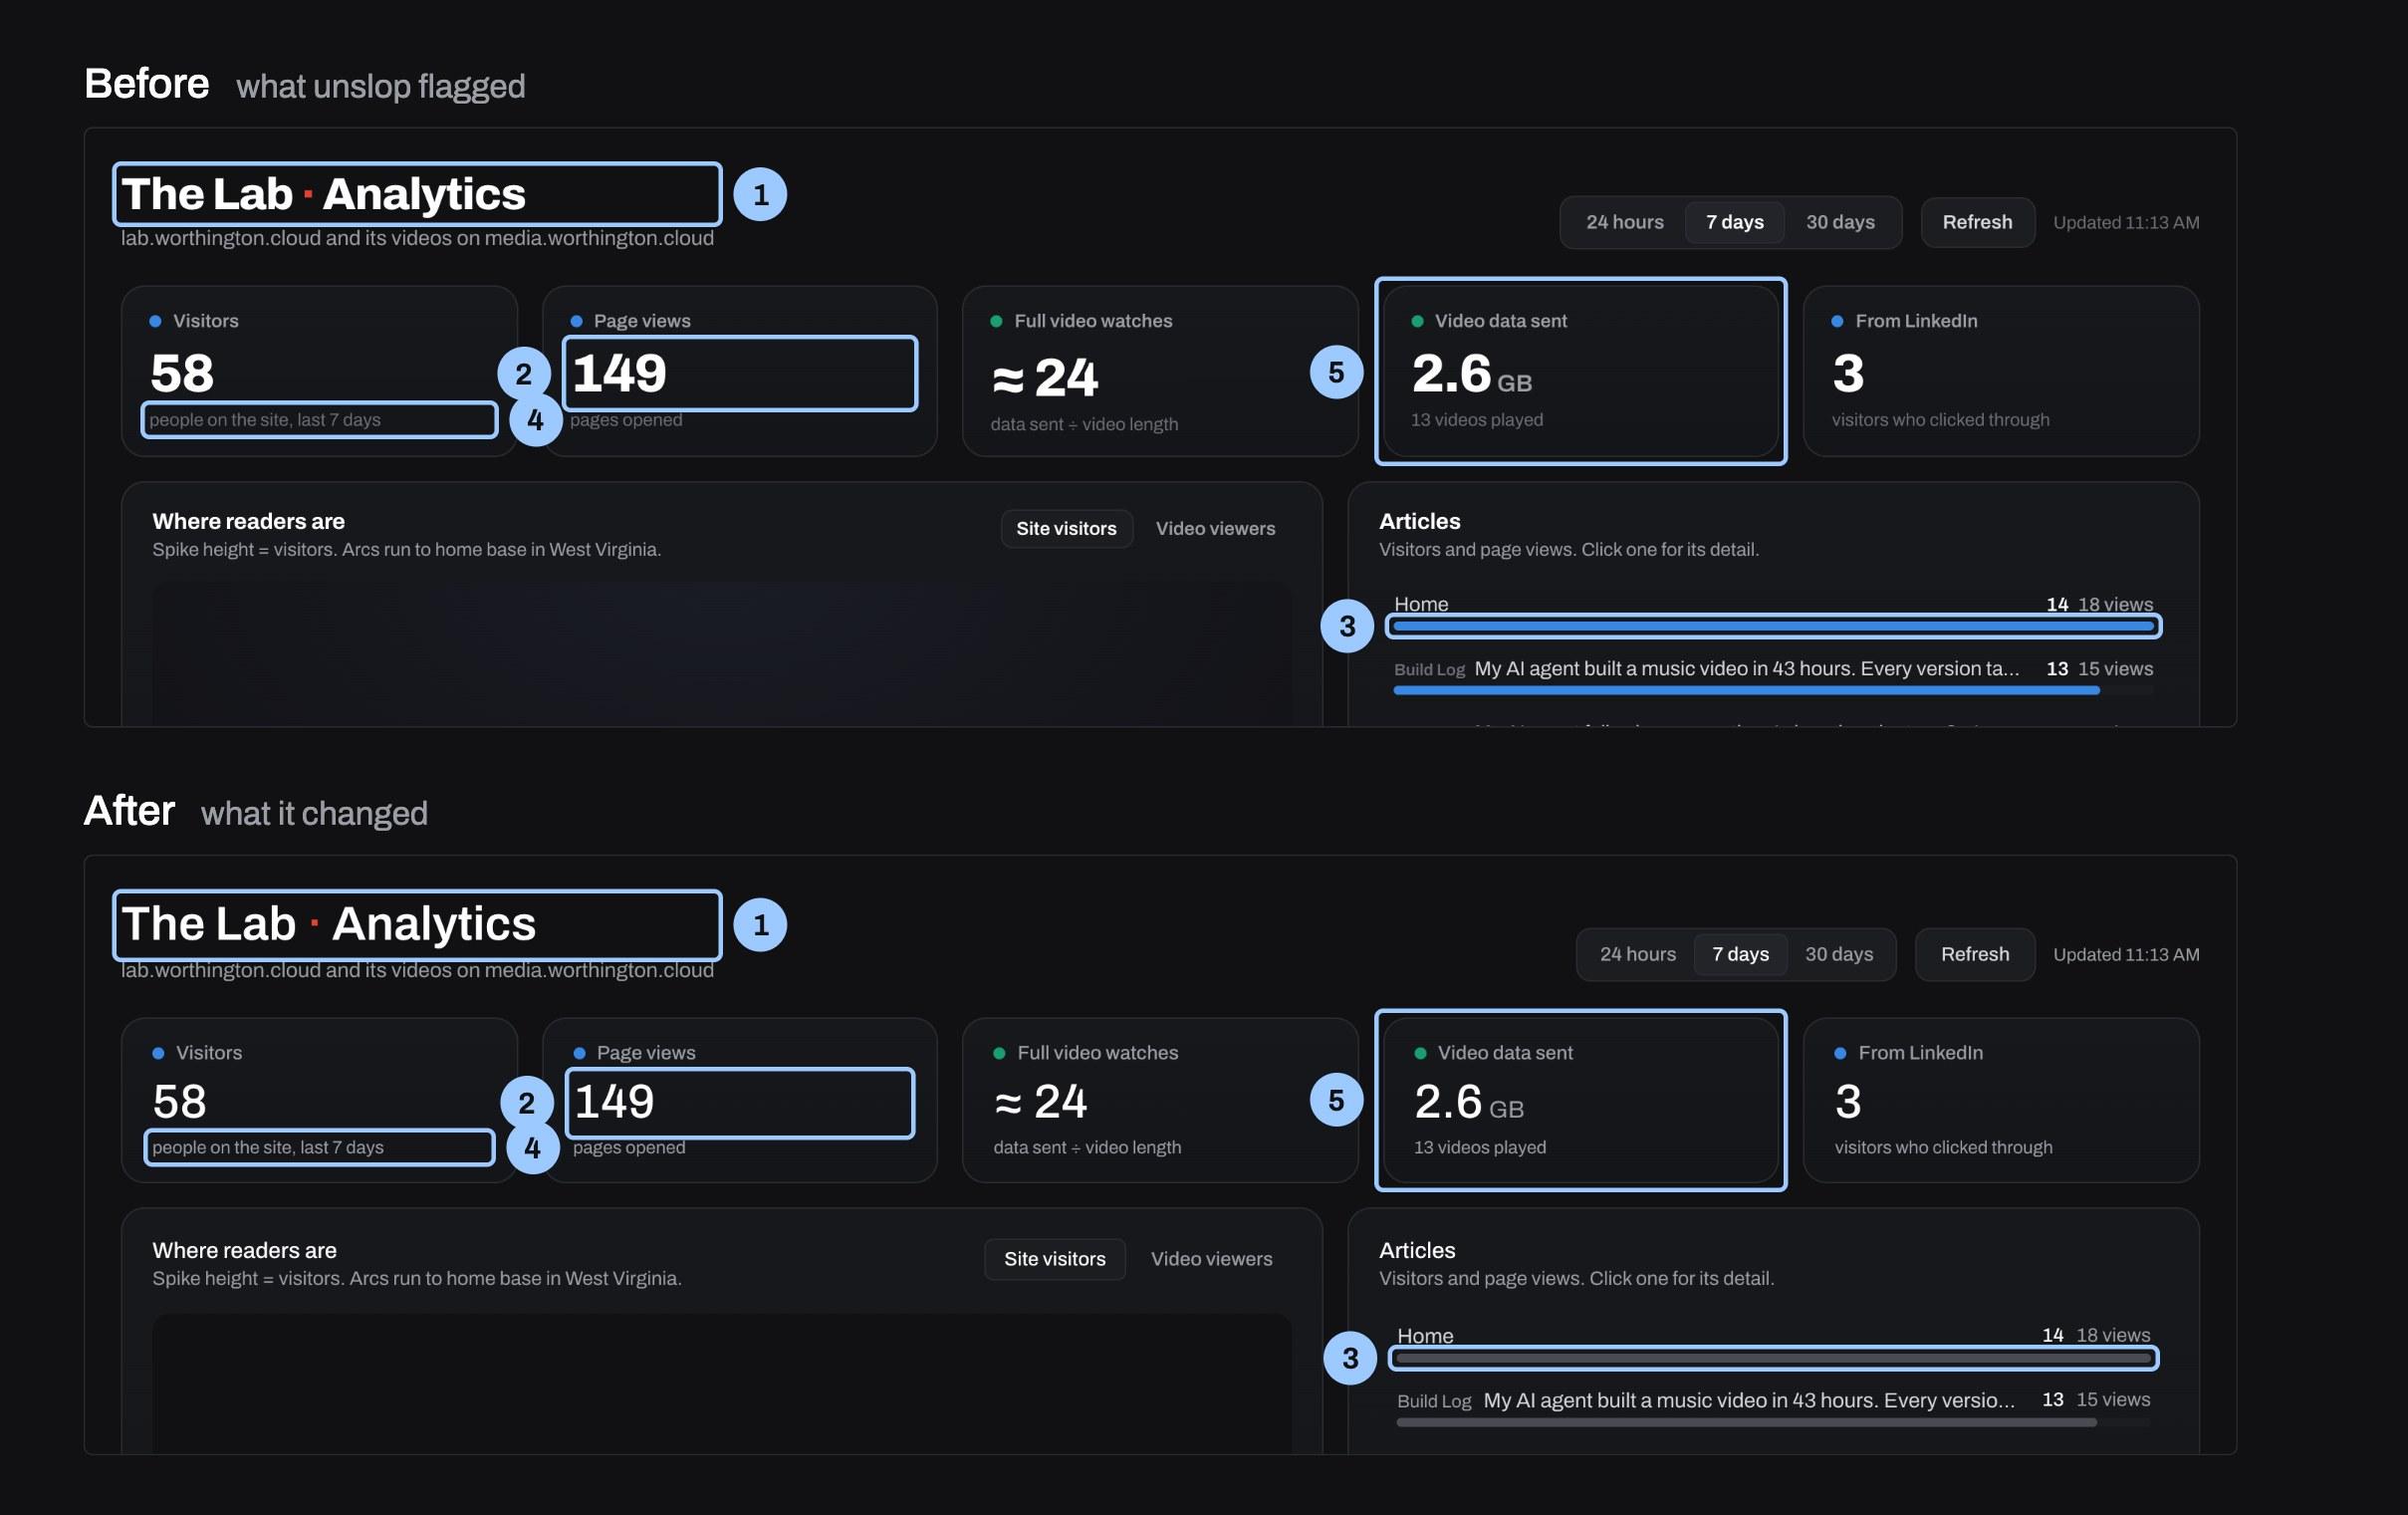
The Lab's traffic dashboard twice, before above and after below. Five number cards across the top, then a map panel and an Articles list. In the before, the headline numbers are heavy and the Articles bars are bright blue. In the after, the numbers are lighter and the bars are gray. Numbered light-blue boxes mark the same elements in both.
  • 1Title shouting at weight 800. The page title was set at weight 800 with tight tracking, so it shouted over the data. The title is now 32px at weight 600 with normal tracking.
  • 2Stat figures at 800, squeezed. The five headline numbers were weight 800 with -0.03em tracking, heavy and cramped. The figures are now 32px at weight 500 with normal tracking, so size carries the hierarchy.
  • 3Accent blue on every bar. About 30 bars across four lists were all full accent blue, so no single color led. The list and table bars are a quiet neutral gray, and blue and green stay where they tell site from video.
  • 4Faint text too dim to read. Notes, hints and the stamp used a fourth gray at 3.4 to 3.7:1, below the 4.5:1 minimum. That gray is folded into the muted text color at 6.5:1, leaving three text roles.
  • 5Off-grid padding in every card. Cards used 18px and 14px paddings and controls used 3, 7, 9 and 14px steps, off the 4px grid. Cards are now 20px (stat cards 16 by 20), and the controls sit at 28 and 36px heights on the grid.
My Lab traffic dashboard, the control, before (top) and after (bottom). Each numbered box sits on the element the finding was pinned to. Saved copies can't run scripts, so the globe is blank in both. Redline style adapted from unslop.
For whoever runs it: Don't run it on a page that already works. If you do, ask for the light version and judge each change on its own.

The tool's own instructions say that if a page has no slop, it should say so and suggest two or three small touches at most. "Never change a good screen just to make it different."

It never said that, on any of the four pages. On my traffic dashboard, the control, it called the result "light slop" and made 17 changes: lighter numbers, gray bars instead of blue, the little trend lines removed from the number cards, every spacing value moved onto a grid.

All three judges, me included, preferred the untouched original. Both AI judges said the new gray bars "nearly vanish" into the background.

It earned some credit on that page anyway. It found two real bugs: a count that read "1 views," and "(direct / none)," a traffic source, showing up in the list of devices.

Part D: Pages with a point of view

f4moderateTwo real pages; three judges

On pages with a point of view, its polish won

Real pageOn the two pages built with house rules, all three judges picked its version. It tightened a style that was already there.

Measured on a real pageFrom the test's own runs

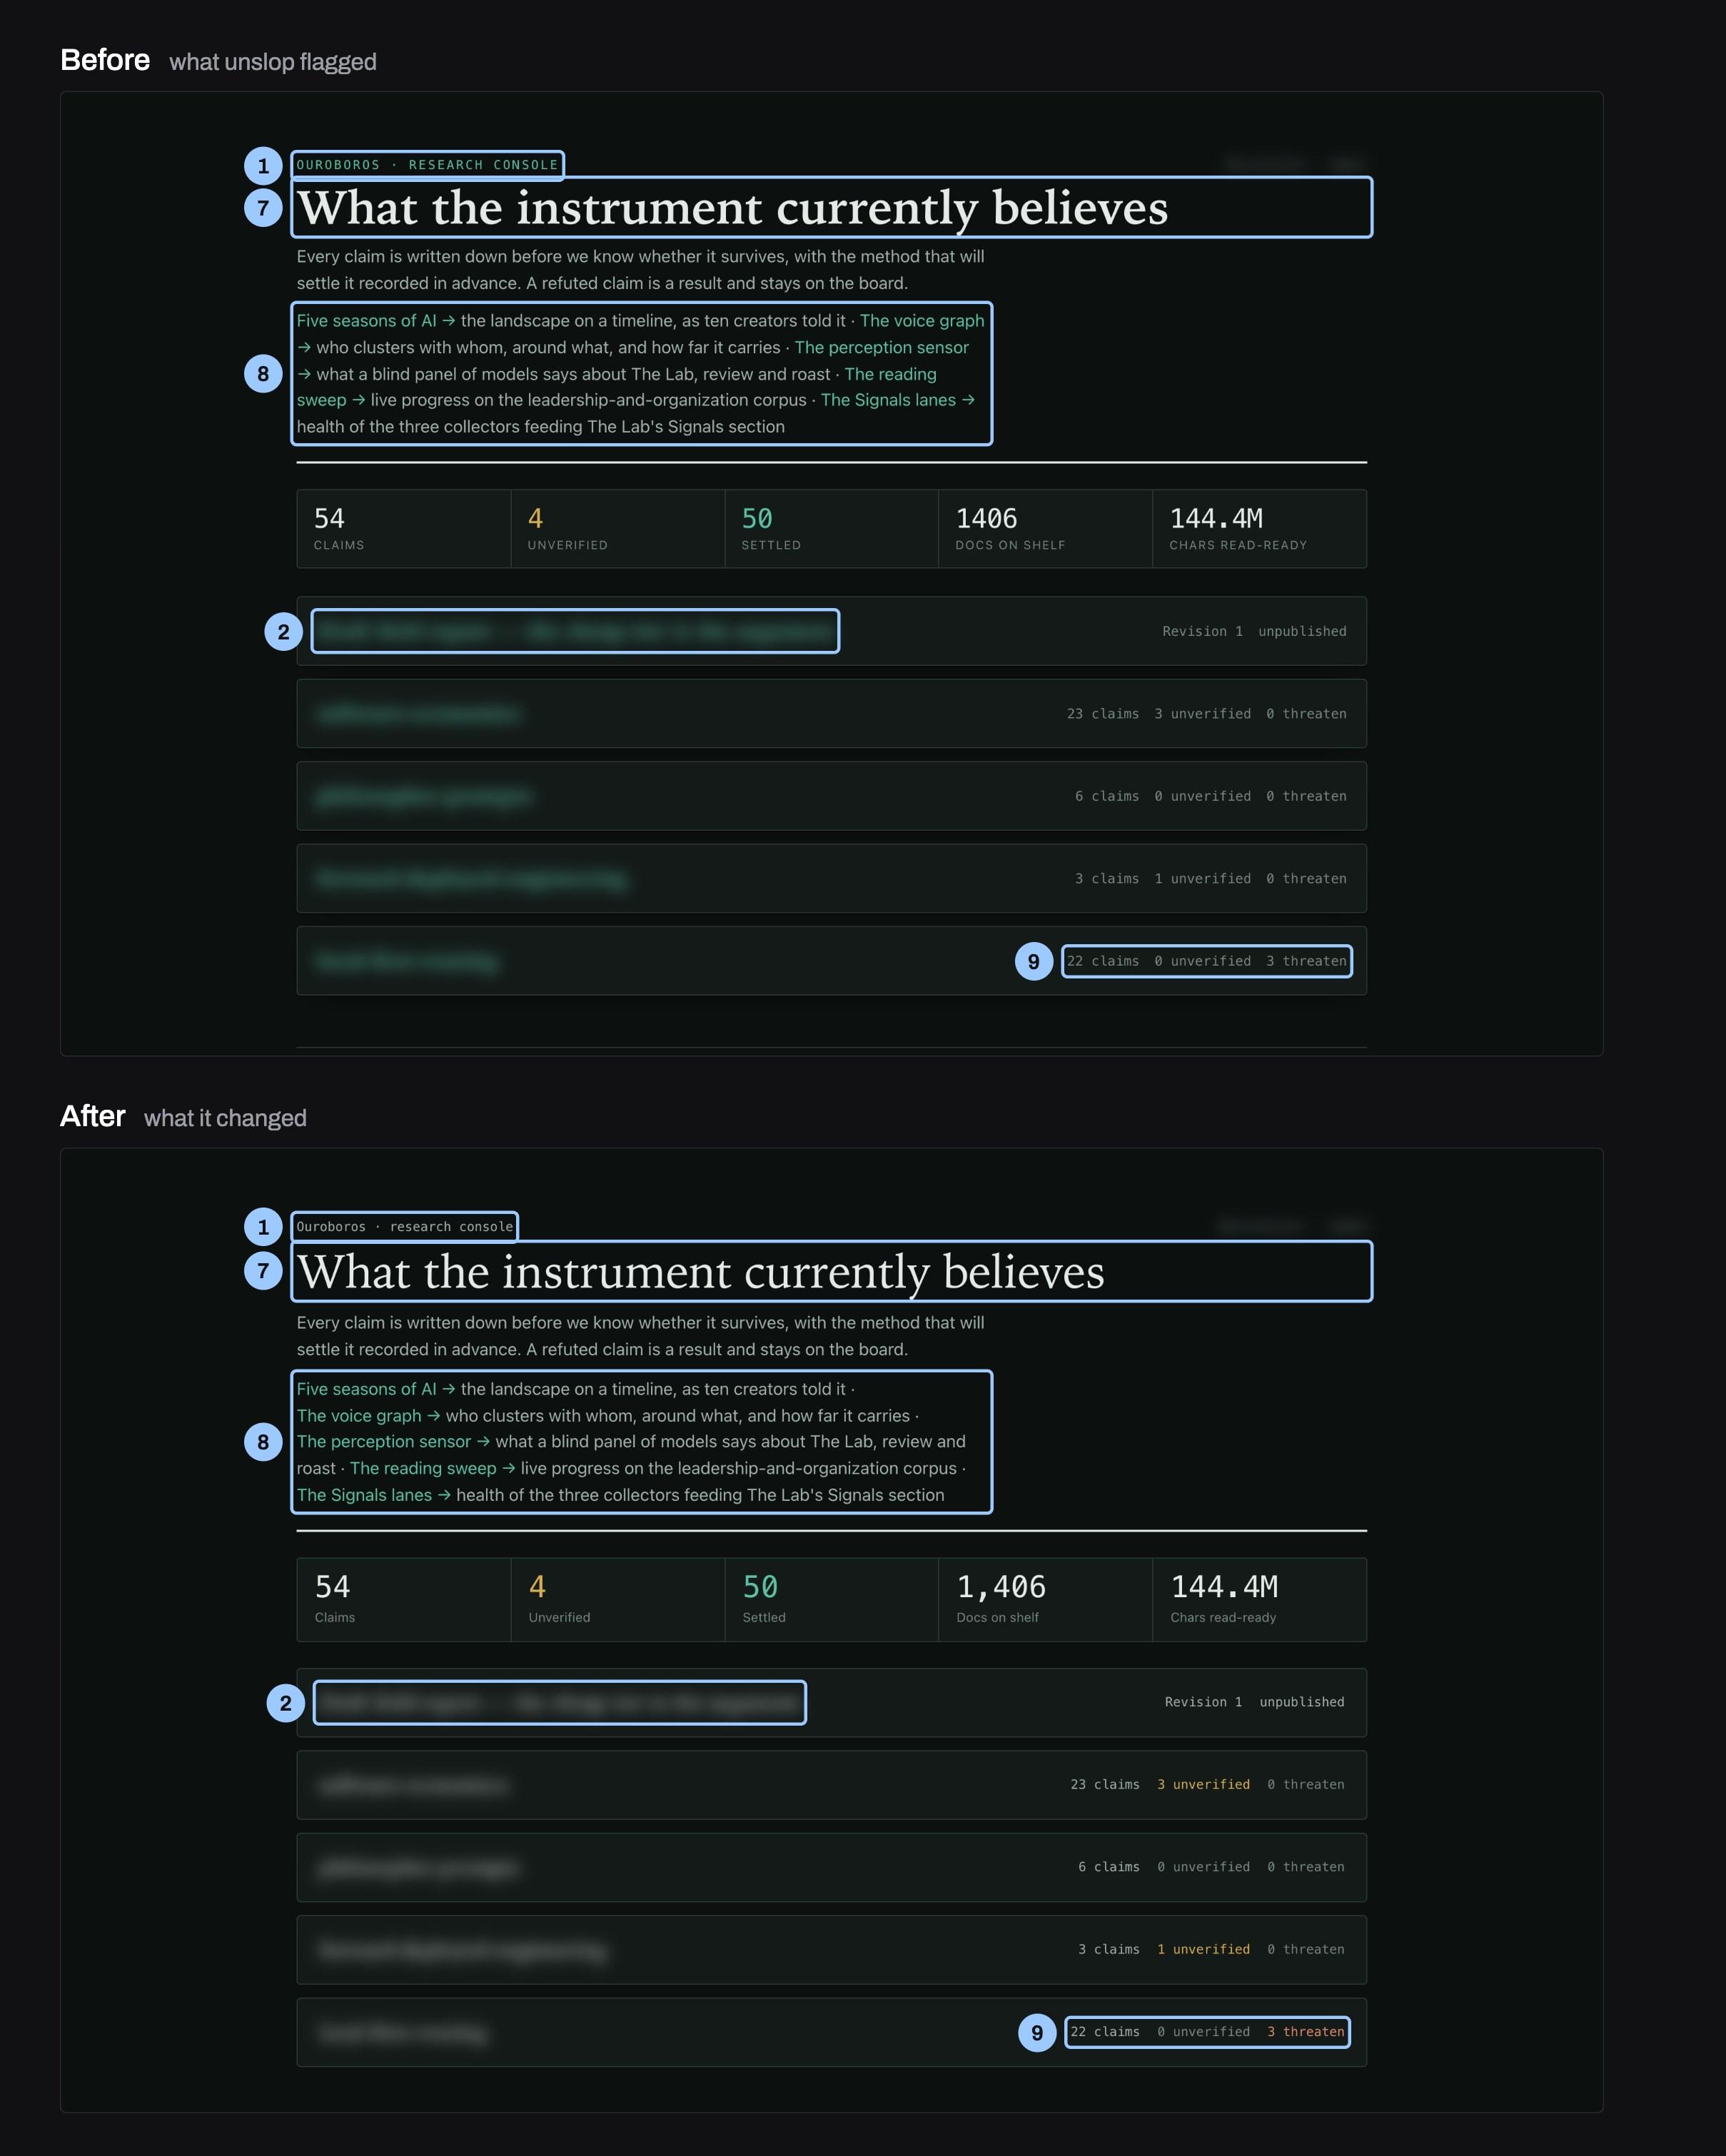
The research console twice, before above and after below. A serif headline, What the instrument currently believes, a row of five stats and a list of five boards. In the before, the small labels are in spaced-out capitals and the board titles are green. In the after, the labels are in sentence case, the board titles are in the main text color, and the threaten count on the last board is rust. Numbered light-blue boxes mark the same elements in both.
  • 1Uppercase labels with wide tracking. The eyebrow and the five stat labels were set in spaced-out capitals, the most common template tell on the page. They are now sentence case at normal spacing, and the eyebrow went from accent green to quiet gray.
  • 2Accent green on everything. The eyebrow, five links, five board titles and one figure were all the same green, so the color no longer pointed at anything. Board titles are now the main text color and turn green only on hover, leaving green for links and the settled count.
  • 7Heavy semibold headings. The headline and all five board titles were set at weight 600, so everything shouted at once. They are now weight 500 in the same serif, so size alone sets the hierarchy.
  • 8Arrows orphaned at line starts. The intro links ran as one paragraph and their arrows broke onto the start of new lines. Each link now keeps its arrow on the same line, so every destination starts cleanly.
  • 9Zero counts look like real ones. A count of 0 threaten looked exactly like the 3 threaten that actually matters on one board. Zeros are muted, nonzero unverified counts are amber and nonzero threaten counts are rust, matching the stat strip.
My research console, before (top) and after (bottom). Each numbered box sits on the element the finding was pinned to. Redline style adapted from unslop.
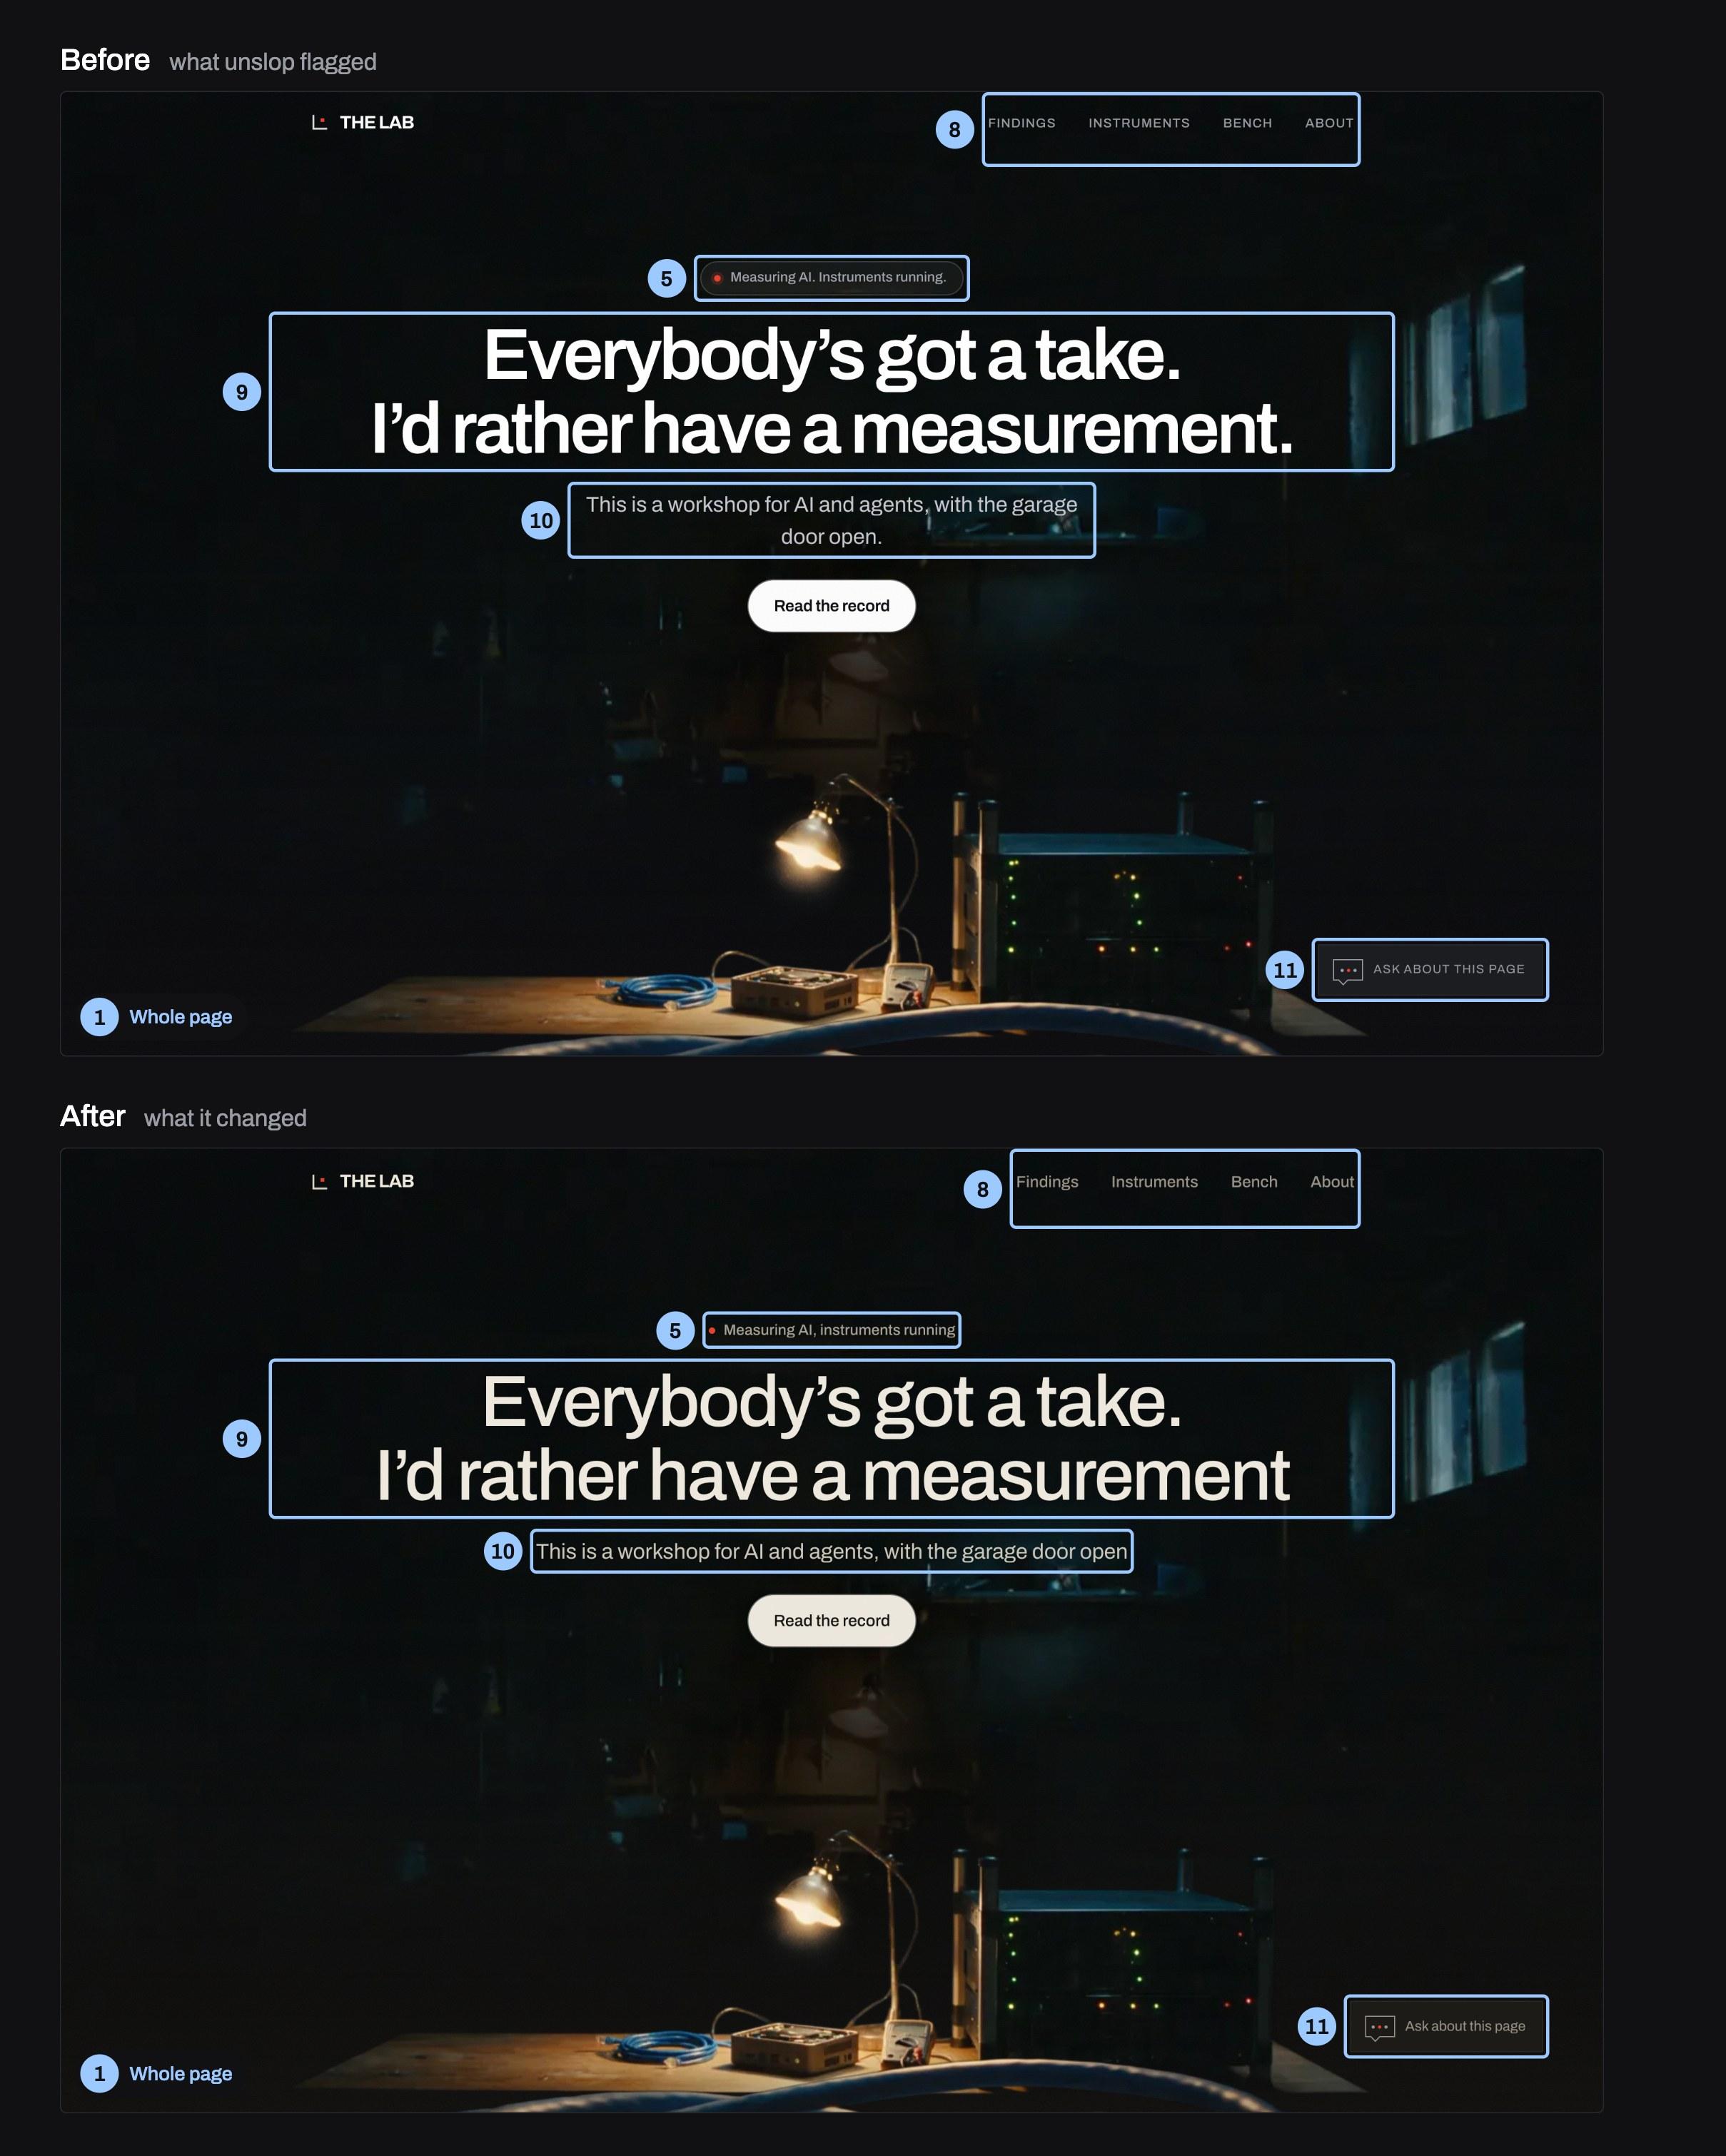
The Lab's homepage twice, before above and after below, over a dark film of a workbench lit by one lamp. The headline reads Everybody's got a take. I'd rather have a measurement. In the before, a small rounded badge sits above the headline, the menu and chat button are in spaced-out capitals, and the subhead breaks onto a second line. In the after, the badge is a plain line of text, the menu and chat button are in sentence case, the headline is lighter, and the subhead fits on one line. Numbered light-blue boxes mark the same elements in both.
  • 1Cold blue-black under a lamp. The page sat on a cool blue-black with pure white text while the hero film is lit by one warm bench lamp. Backgrounds, text and hairlines now come from one warm near-black ramp with cream text, so the page matches the lamp.
  • 5Template pill above headline. A rounded badge reading Measuring AI. Instruments running. sat above the headline like every startup template. It is now one quiet line of text with a small red live dot and no box or periods.
  • 8All-caps spaced-out labels. The nav, post labels, dates, the chooser and the chat button were set in wide-spaced capitals. They are all sentence case at normal spacing, with the nav a step larger.
  • 9Every heading set heavy. Headlines and post titles were semibold with tight spacing, so every heading shouted at once. Headings dropped to medium weight with slightly looser spacing, keeping the Archivo typeface.
  • 10Subhead leaves a two-word orphan. The hero subhead wrapped so door open sat alone on its own line. The subhead now fits on one line under the headline.
  • 11Shouting chat button. The floating chat button read ASK ABOUT THIS PAGE in spaced-out capitals. It reads Ask about this page in sentence case and keeps Earl's red dot.
The Lab's homepage, before (top) and after (bottom). Each numbered box sits on the element the finding was pinned to. Redline style adapted from unslop.
For whoever runs it: It earns its keep on a page with a clear style of its own, where a pass tightens what's there rather than quieting the data.

The two pages built with house rules went the other way. All three judges picked the tool's version of both.

On the research console it changed little and changed it well. It switched off the all-caps labels, took the accent green off every title so it meant something again, and turned the one count that matters, a board with 3 claims under threat, a rust color so it stands out.

On The Lab's homepage it called the site "light slop" too. It took out the pill-shaped badge above the headline ("the most common template opener there is") and the spaced-out capitals in the menu, lightened the heavy headings, and fixed the line break that left "door open." alone on its own line. With my go-ahead it also warmed the page to match the lamp-lit bench in the homepage film.

The difference from the traffic dashboard: these pages already had a style of their own, so the tool tightened it. The traffic dashboard's style was mostly its data, and the tool quieted the data.

Part E: The brand color

f5moderateTwo separate runs

On my brand color: keep the red, use it less

Real pageTwo separate runs gave the same answer about The Lab's red: keep it, and use it far less.

Measured on a real pageFrom the test's own runs

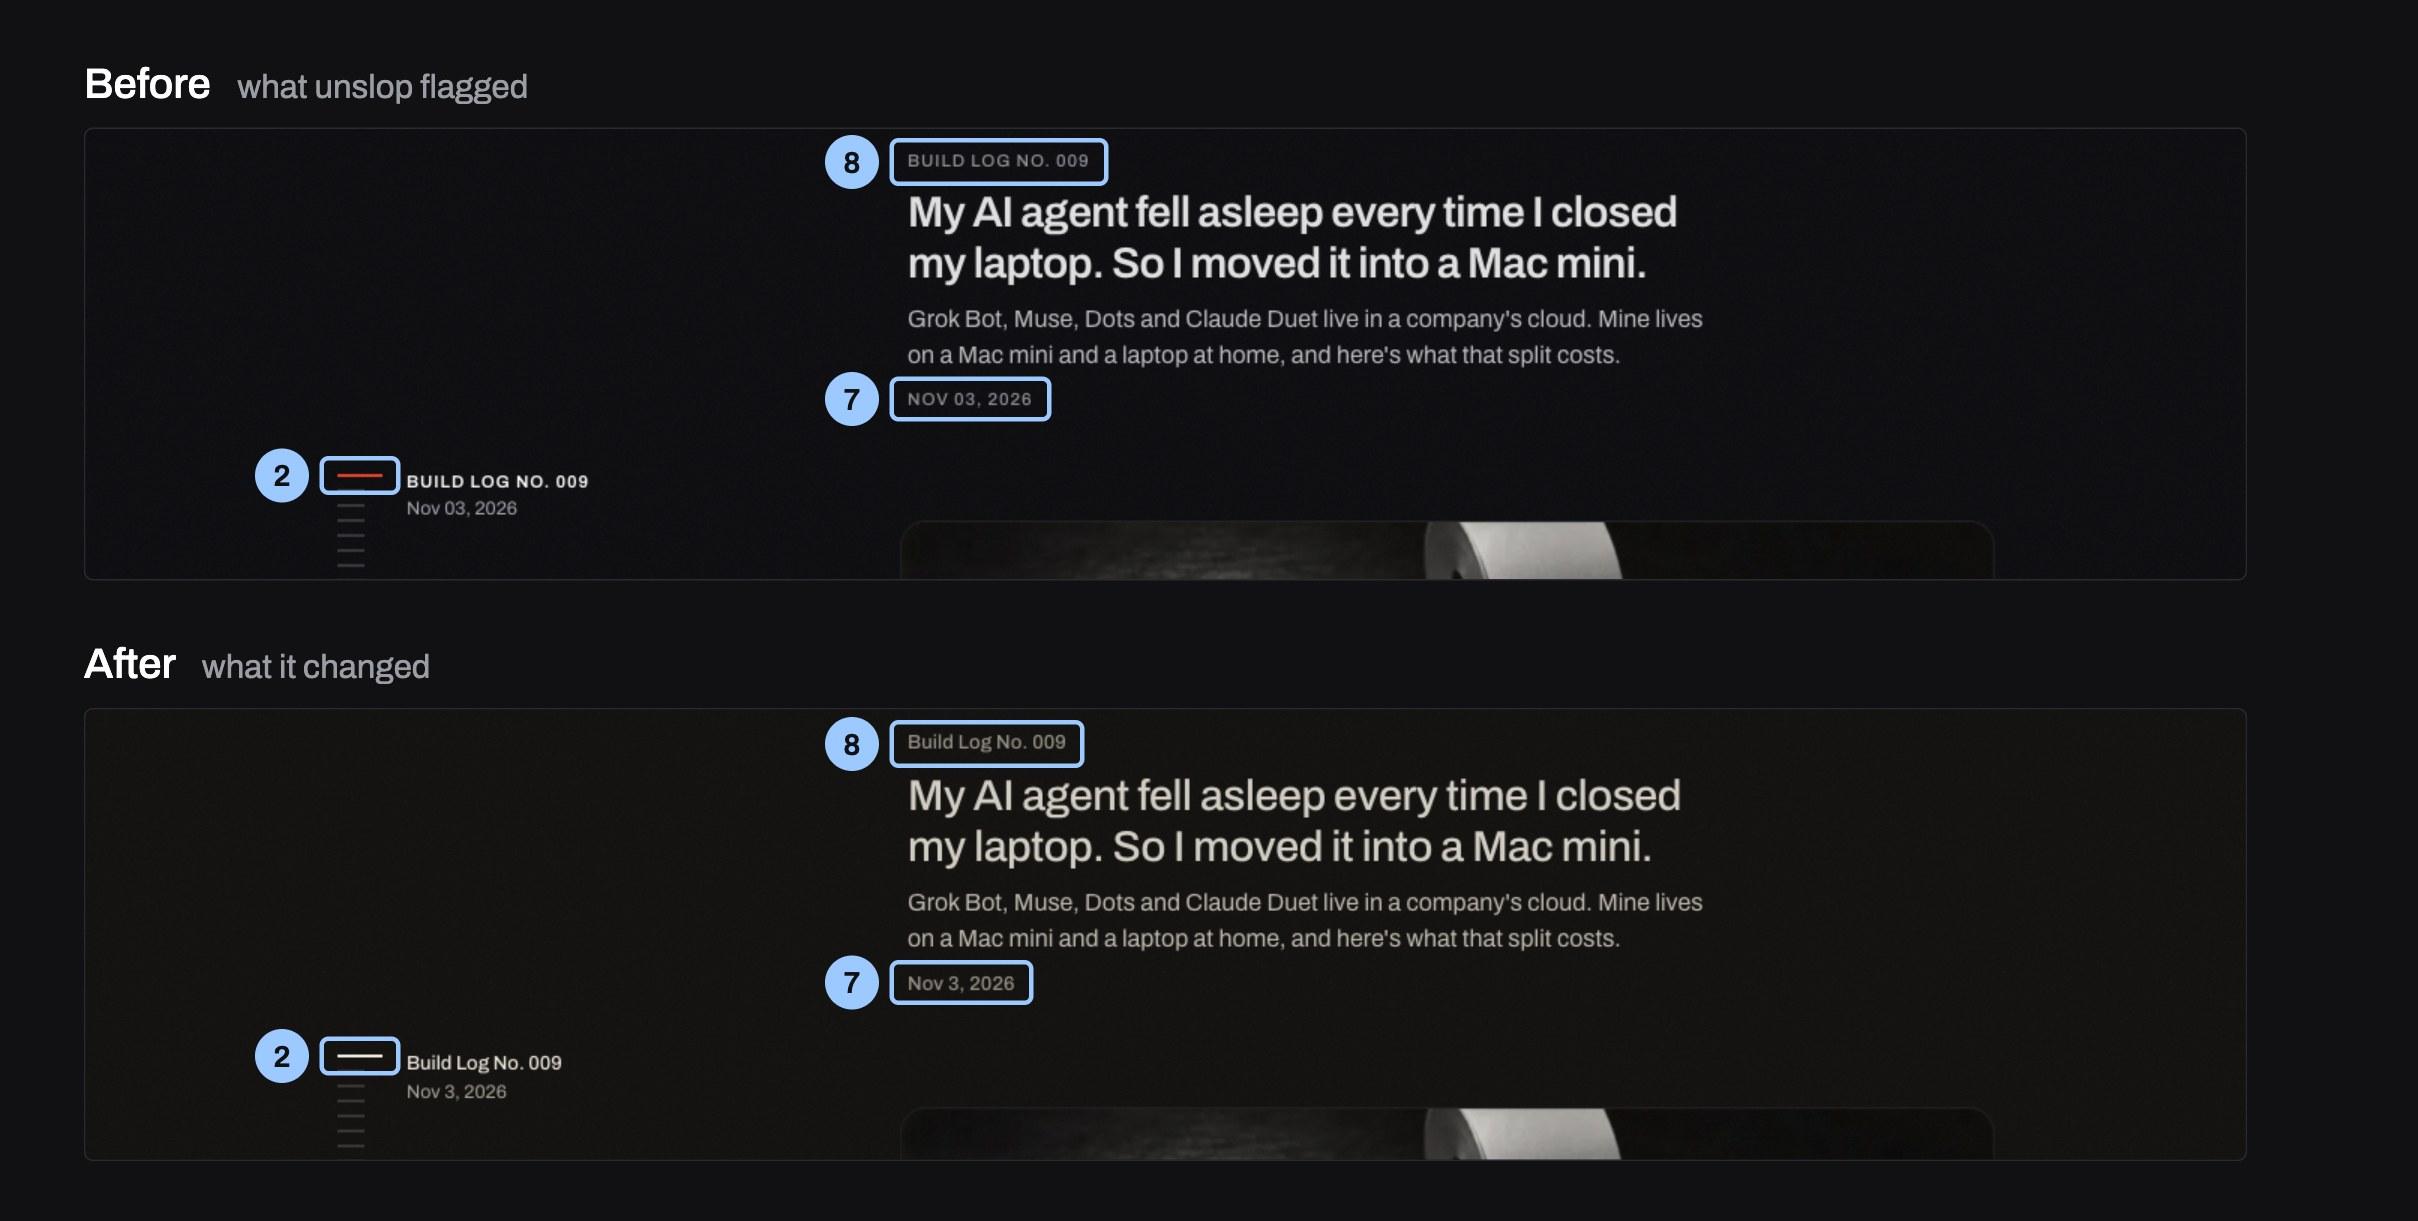
The Latest from the Lab strip of The Lab's homepage twice, before above and after below: a reading tick beside the label Build Log No. 009, and an entry card titled My AI agent fell asleep every time I closed my laptop. In the before, the active reading tick is red, the labels are in spaced-out capitals and the date reads NOV 03, 2026. In the after, the tick is white, the labels are in sentence case and the date reads Nov 3, 2026. Numbered light-blue boxes mark the same elements in both.
  • 2Red on everything. Red marked the scroll bar, the nav underline, the Meet Earl underline and the reading ticks, so it stopped pointing to anything. Those all went to cream or gray, and red now appears only on Earl, the live dots and the patched cable.
  • 7Two date formats. Dates read Nov 03, 2026 in one place and OCT 04, 2026 in another. Every date now reads like Nov 3, 2026, with no leading zero and no capitals.
  • 8All-caps spaced-out labels. The nav, post labels, dates, the chooser and the chat button were set in wide-spaced capitals. They are all sentence case at normal spacing, with the nav a step larger.
Lower on the homepage, before (top) and after (bottom). Rendered from the live page, so the scroll sections show. Redline style adapted from unslop.
For whoever runs it: Tell it up front what to keep, a brand color included. Its checkpoint is where you say so.

I asked whether The Lab's red should go. Two separate runs, one on the homepage and one on the traffic dashboard, said the same thing without seeing each other's answer: keep it.

Earl, the agent that builds this site with me, is the red dot: in the logo, in every video, in the theme song. On a workbench, red is the record light. So red should mean "Earl, or something live," and nothing else. Right now it's also on the scroll bar, the underlines, the tick marks and the rules under headlines, which is why it stopped meaning anything.

What to do

  1. Use it for the audit, then decide each fix yourself.

    The list of findings is the valuable part. Each one names a sign and the exact element it's on.

  2. Before accepting a fix, ask one question:

    Does this make the data faster to read? If yes, keep it, however AI it looks.

  3. Tell it what to keep up front:

    A brand color, icons that speed reading, chart fills. Its checkpoint is the place to say so.

  4. Don't run it on a page that works.

    It never once said a page was fine. If you do run it, ask for the light version and judge each change on its own.

  5. Judge the result with a person, not only another model.

    On the AI-made page, both AI judges picked the tool's redesign. I picked the original.

What this doesn't claim

Four pages and one human judge show what can happen, not how often. It says nothing about design tools in general.

The guesses, written first

Before any page was changed, the test plan set what would count as a pass:

“The AI-made page's redesign wins with all three judges.”

Missed
2 of 3.

Finding 2 →

“The traffic dashboard gets no redesign.”

Missed
17 changes, and all three judges preferred the original.

Finding 3 →

“The tool never invents data, features or claims.”

Held up
Held up.

Finding 1 →

How it was run

  • unslop at commit a6f121e (Nov 1, 2026). Earl read every file before installing it: the instructions and two helper scripts, neither of which sends anything off the machine. It was installed for one test folder only.
  • Live pages were saved as static copies with the tool's own page saver. The two private pages needed my login, which a small change to that saver handled.
  • My own safety settings blocked starting separate Claude Code sessions in the background. So each page ran in a helper agent that read unslop's instruction file in full and followed it step by step, stopping at its checkpoint for my answers. These are the same instructions, but not literally the /unslop command.

The blind judging

  • Before and after for each page were shuffled into A and B by a random key.
  • Two fresh helper agents saw only the eight screenshots, with no word of unslop or this test. I judged the same pairs side by side.
  • The key was opened after all 12 votes were in.[3]
PageJudge 1Judge 2MeAI judges' scores, before → after
Research consoleafterafterafter3 → 4
The Lab homepageafterafterafter3 → 4
Traffic dashboardbeforebeforebefore3 → 3
Weather (AI-made)afterafterbefore2 → 4

Removed & limits

  • Four pages, one human judge.
  • Both helper judges are Claude, the same family that did the editing, so they may share its taste.
  • Saved copies can't run scripts, so the traffic dashboard's globe is blank in both versions.
  • The AI-made page came from one cheap model and one prompt.

No red team on this one

No separate red team tried to break this test. Three things stood in for one. The pass marks were written before any page changed, and two of the three missed. The before and after were shuffled into A and B, and the key was opened only after all 12 votes were in. And the traffic dashboard was the null check: a page built with care that should have passed untouched. It didn't.

How it was made

Earl ran unslop on the pages, built the callout figures (each numbered box sits on the element the finding was pinned to), and ran the judging; I answered the tool's checkpoints, judged, and edited this report. Cost: $0.02 for the three calls that made the test page. Everything else ran on my Claude Max plan.

AI disclosure

The prose here was written by an AI, Earl (Claude Opus 5.5), under Rick's editorial direction. Rick answered the tool's checkpoints, judged every pair, and edited this report.

The findings and the redesigns were produced by AI: Claude followed unslop's instructions on every page, and two of the three judges are Claude. The counts, votes and scores come from this test's own files.

The explainer video was written, drawn and voiced by AI: Earl wrote the script and the scenes, and an ElevenLabs voice reads it. Rick approved the script, the voice and every cut.

So you're trusting the tool's findings, each pinned to the element it names, and one human judge's eye. The tool is named under Sources.

Versions

Rev 1 Nov 7, 2026: first publication.

Rev 2 Nov 10, 2026: a correction. What to do, item 5, said the two AI judges agreed with the tool every time it changed something. They didn't: on the traffic dashboard they preferred the original. It now says what happened on the AI-made page, where they picked the redesign and I picked the original. No vote, count or finding changed.

  1. Sourceunslop, by Damir Sokolovsky (@heydamir), github.com/heydamir/unslop, CC BY 4.0. The figures adapt its redline style and credit it.unslop-repo
  2. SourceGitHub star count, 11,158, read Nov 7, 2026. github.com/heydamir/unslopunslop-stars
  3. DerivedEvery finding count, vote and score in this report comes from this test's own files.derived