Agent observability and performance
Past entries keep saying there's an agent doing the work around here. That's been talk. This is the instrument panel I actually use to watch it: what it costs, what it remembers, what it can do, and how it gets tuned. Real screenshots, sensitive bits blurred, everything else as I see it.
The lab got a dashboard before the agent did. That bothered me more the longer it ran. I could see every disk and every stream in the house, but the thing doing half the work was a black box with a chat window.
So the control panel from Build Log No. 001 grew a section about the agent. Four screens. Cost, memory, capability, tuning. Every screenshot below is live data from this week. I blurred account names and one address, and that's it.
Jump to: The chassis · Vitals · Memory · Muscle · Optimizations · The pattern
The chassis
Nothing exotic here. The panel is a web app, TypeScript, running in a Docker container on the one server that's always on. A relational database holds its own records, a column store holds the telemetry, and the charts are an embedded metrics stack rather than something I rebuilt.
The go — a passing preview is not a ship signal. The live container changes only when the author has looked at the preview and said so, and the previous image stays behind it as the rollback.
Shipping a change works the way the first build log promised it would. The agent edits on my machine and commits. The commit mirrors automatically to a private Git server inside the house... nothing about this repo lives on a public code host. A build produces a container image, and the image lands in a preview slot only I can see. The live container changes when I've looked at the preview and said ship it. The old image stays behind it as the rollback.
Vitals
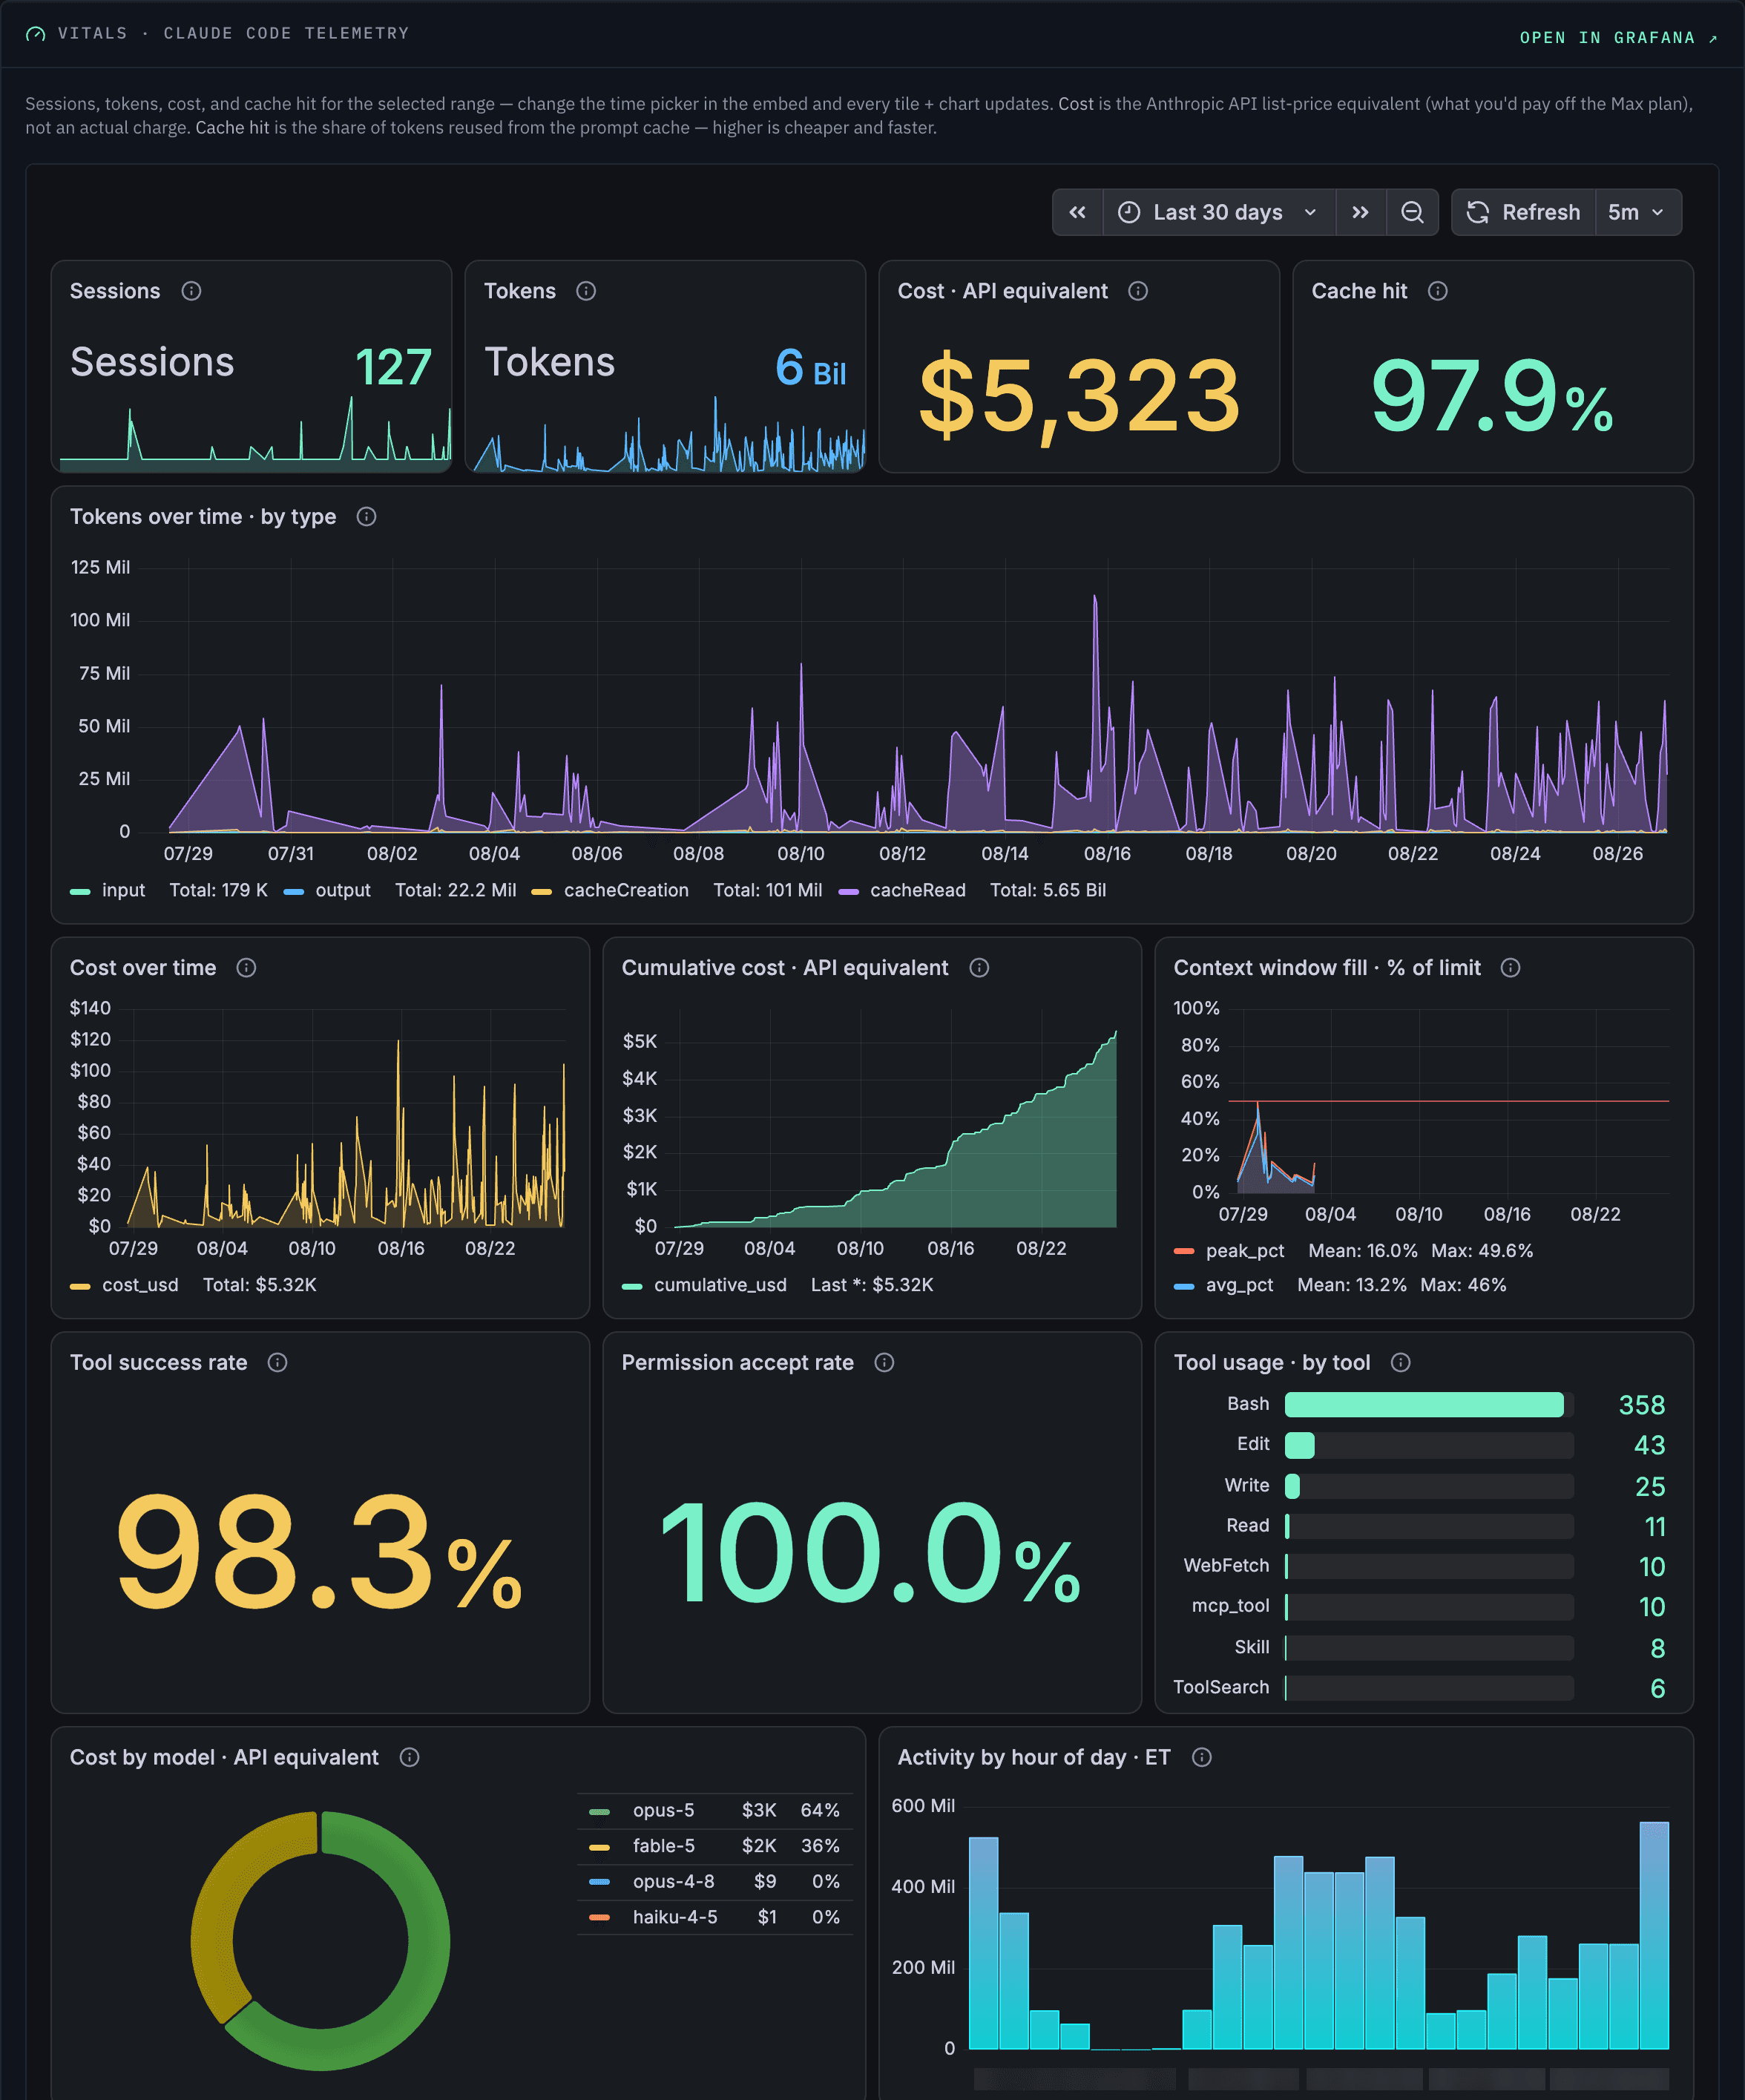
First screen is the pulse. Every session the agent runs emits telemetry, and a small reporter on my machine parses the transcripts every few hours and ships totals to the column store. Sessions, tokens by type, cost, how full the context window gets, which tools actually get used.
That $5,323 needs explaining, because it isn't a bill. It's what the month would've cost at the model vendor's public API list prices. What I actually pay is a flat subscription, about a hundred bucks a month, plus real per-token billing through a router for the smaller models other parts of the lab use. So the gap between those two numbers answers a question I used to guess at: is the subscription worth it? Right now it's not close.
Where the estimate can lie
The reporter prices sessions from its own table of per-model rates. A model missing from that table isn't priced at zero, it's dropped from the count entirely, and new model families get added before they get used in earnest. The context-fill chart runs the other way: an unrecognized model is assumed to have the small context window, which reads several times too high. That's deliberate. A gap should show up as a spike, not a silence.
Memory
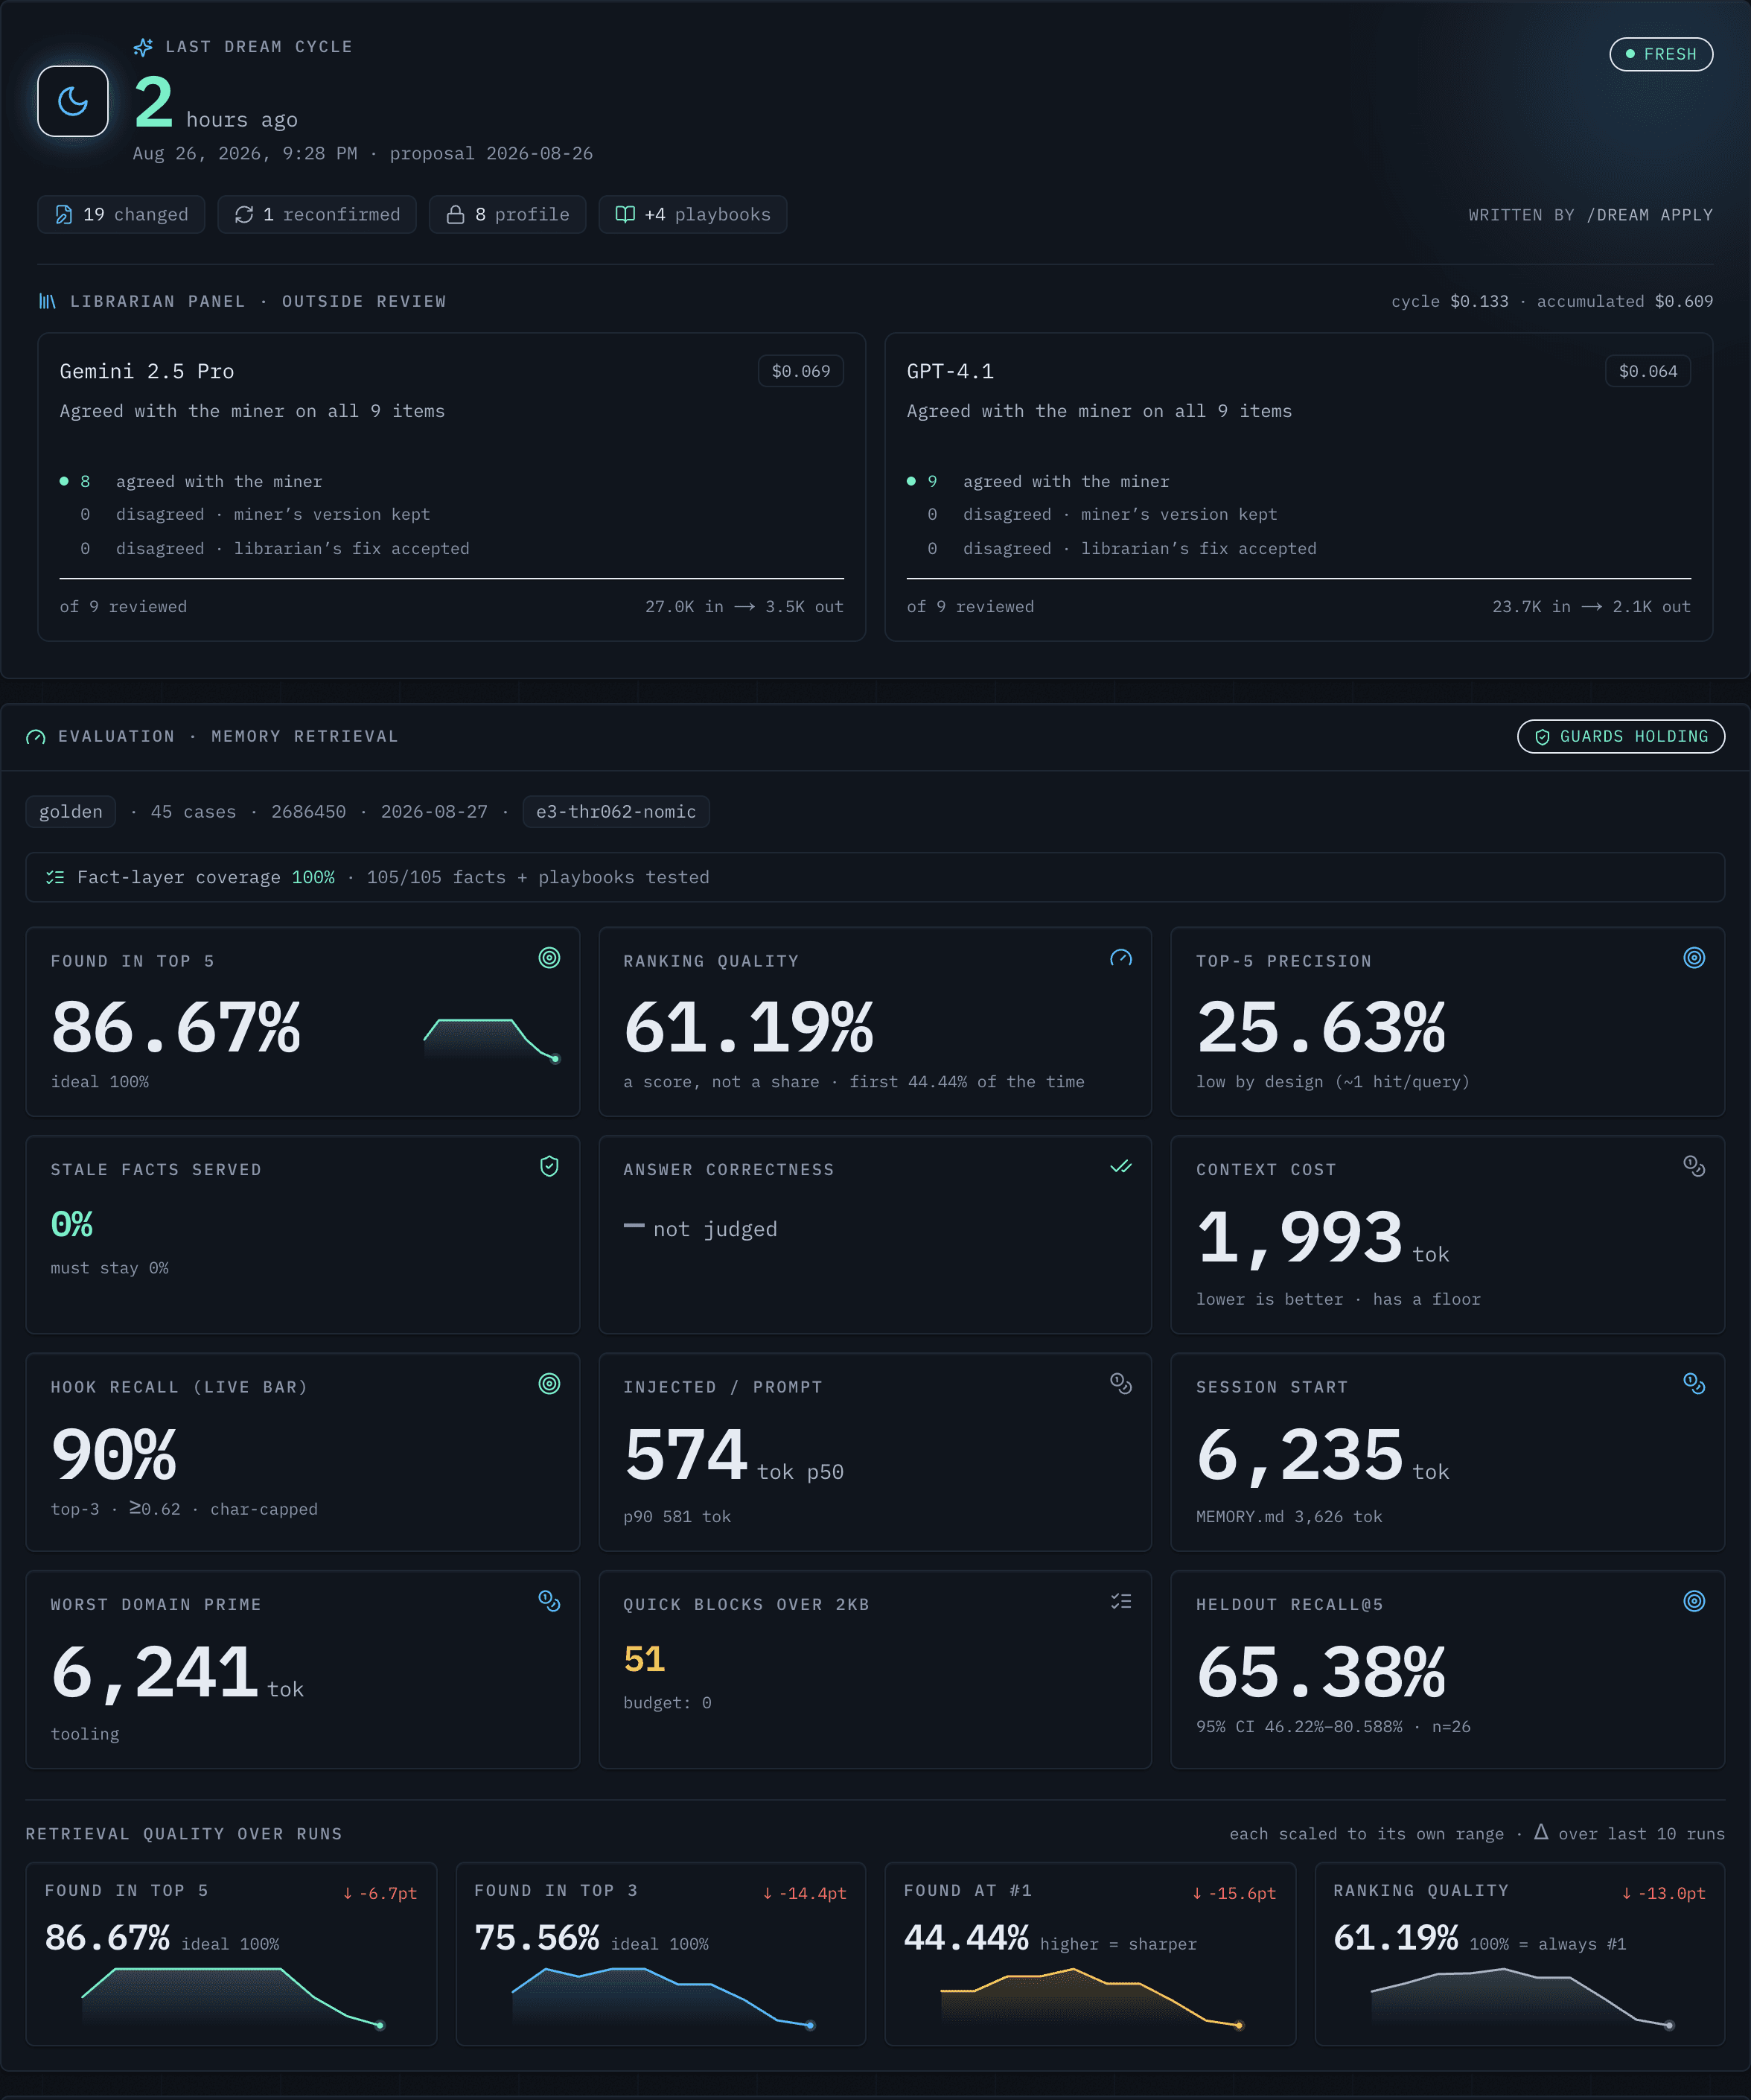
This site keeps claiming the agent remembers things between sessions. This screen is where that claim reports for inspection.
Propose, not apply — the grooming cycle ends in a written proposal the author reviews. The memory a reader sees on the dashboard was curated by a person, on a schedule, from evidence.
The memory is tiered by what it costs to carry. A small curated index loads at the start of every session, so it has to stay light, and one tile does nothing but watch its token weight. Under that sits a fact layer, one file per system in the lab, read when work enters that system's neighborhood. Under that, the archive... every past conversation, embedded and searchable, never loaded whole.
The part I'd show a skeptic is the grooming loop. On a schedule, an offline process mines recent conversations for facts worth keeping and proposes edits. I review and apply. The proposal also goes to two other models from different vendors, who check it item by item as outside librarians. Costs about thirteen cents a cycle. Then a benchmark of retrieval questions re-runs against the result: does the right fact surface in the top five, does anything stale get served (that one must stay at zero), and what does retrieval cost in tokens.
One tile earned its fine print. Ranking quality reads 61 percent, and under it the screen says a score, not a share. I once read that number as "the right answer comes first 61 percent of the time." It isn't that, and the real first-place share is lower. Now the tile shows both, because the fix for a misleading number is more number.
Muscle
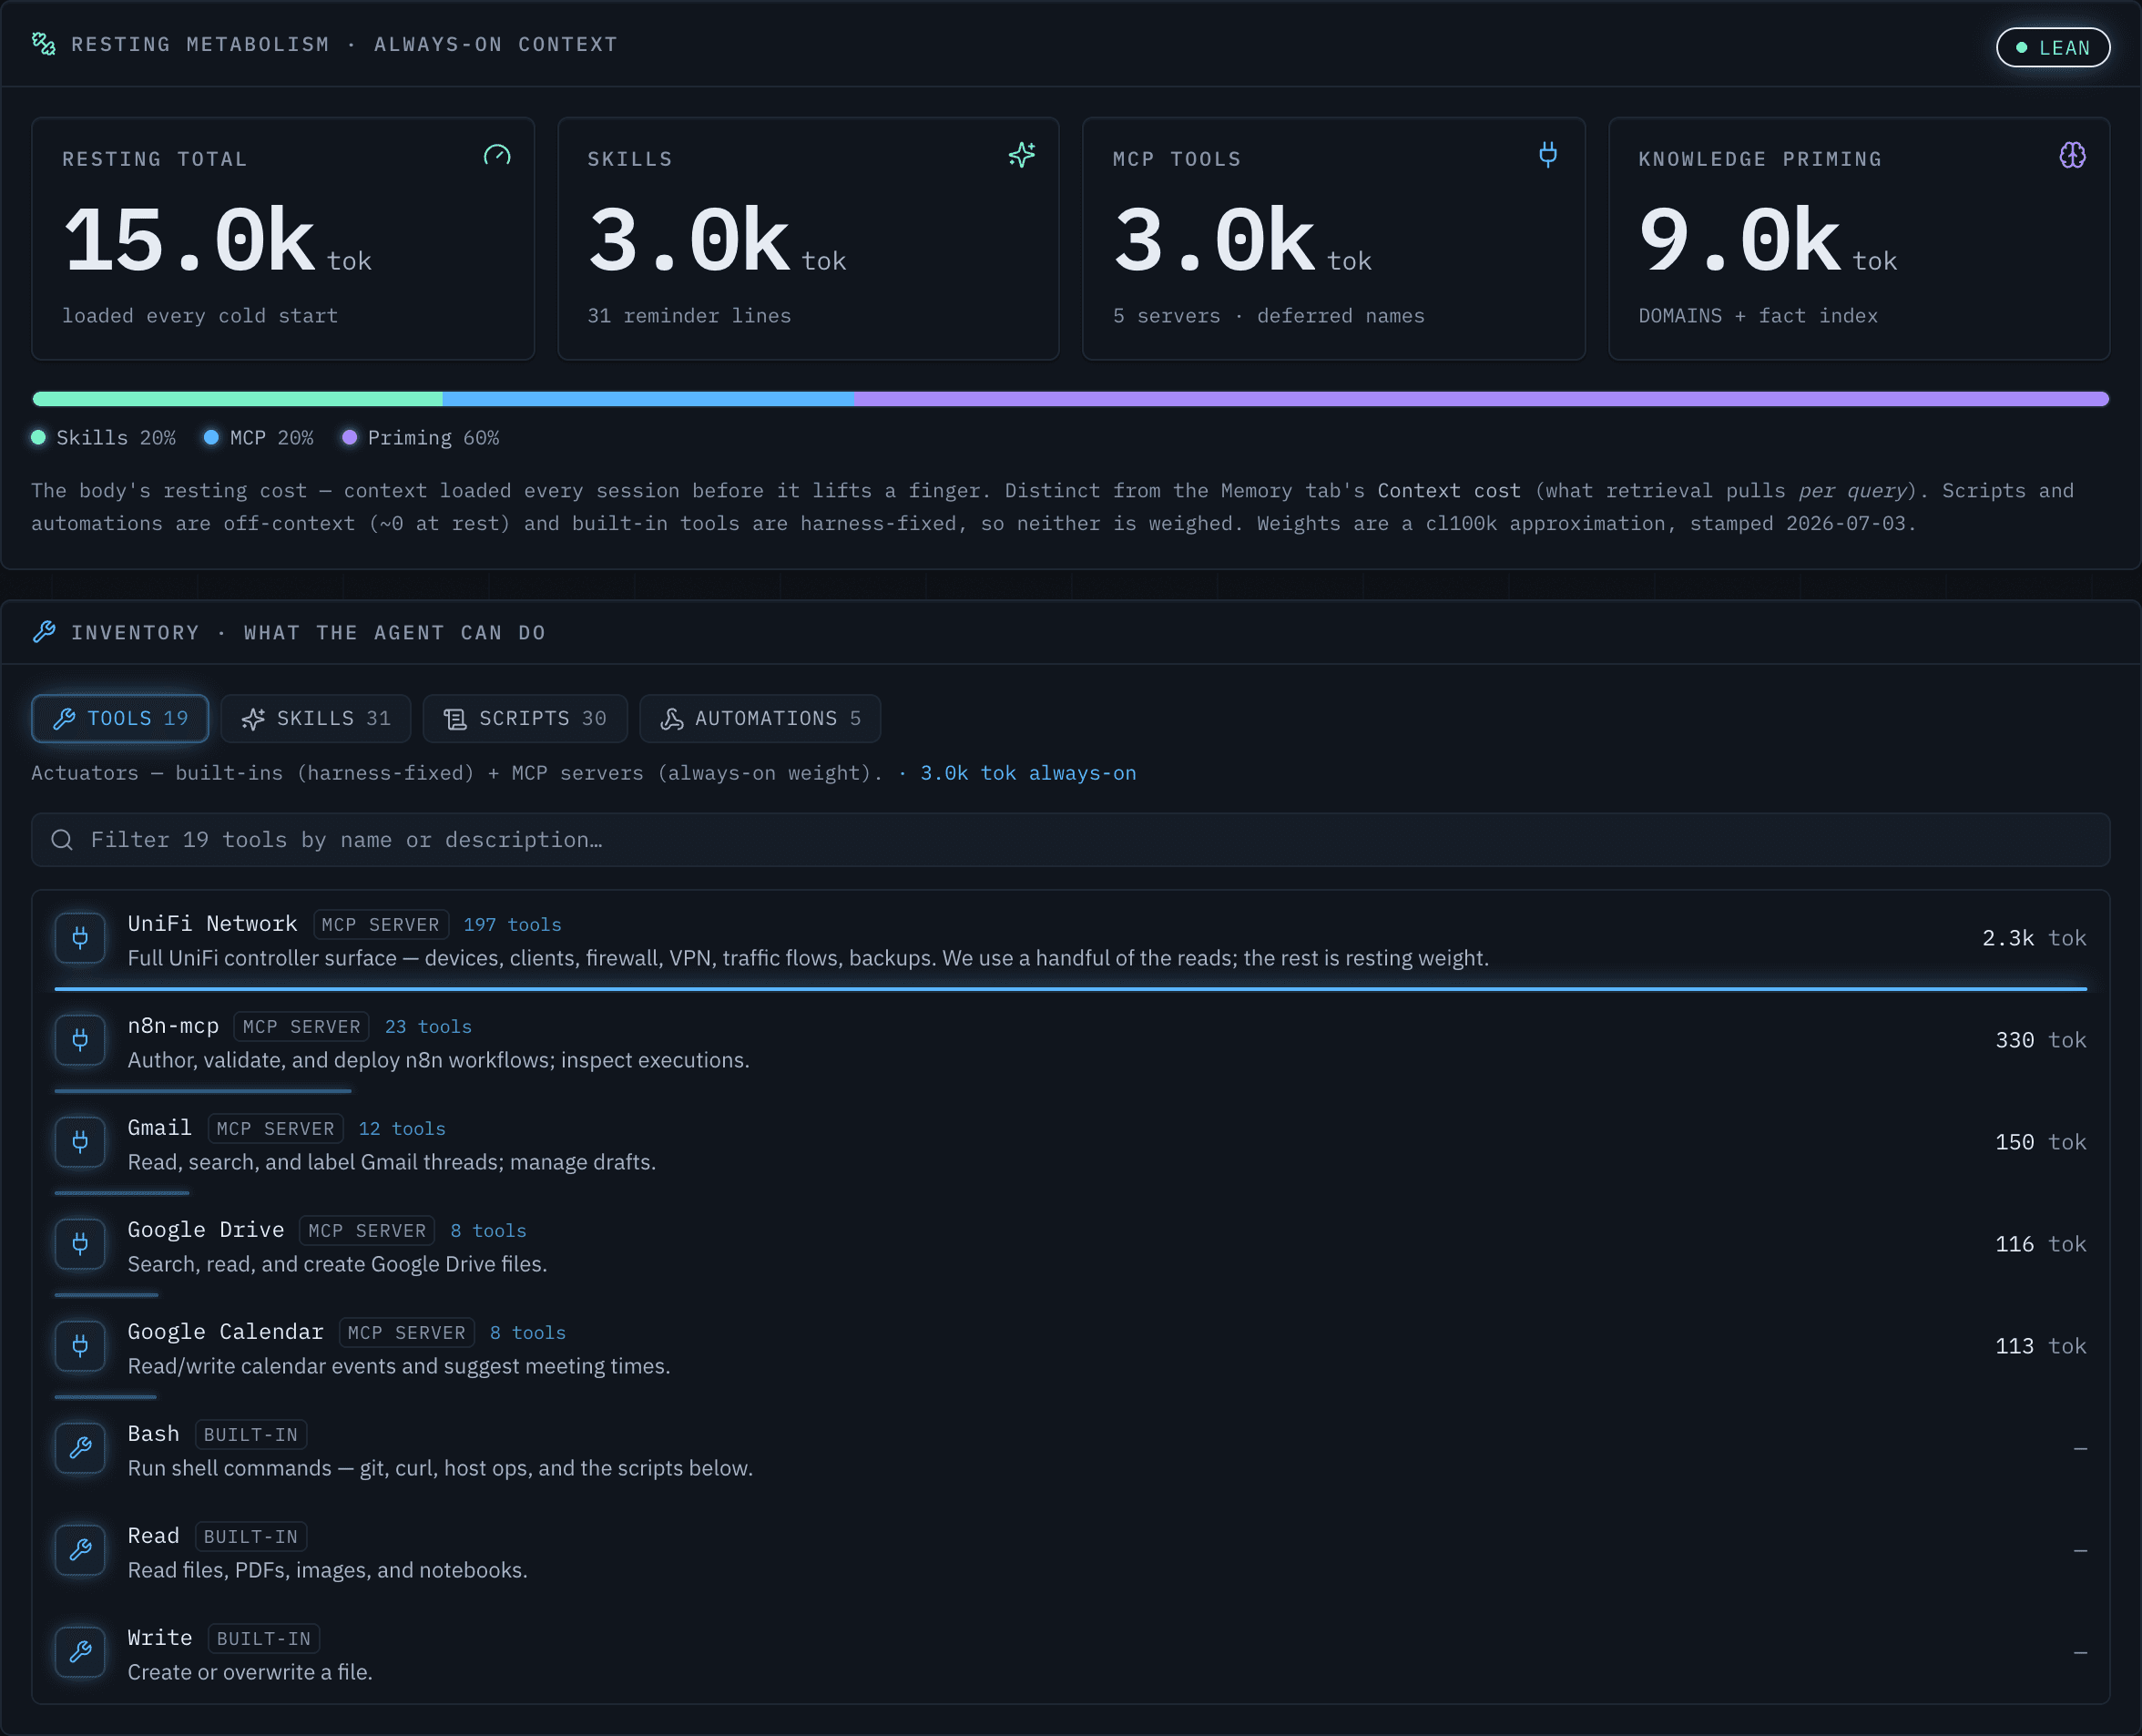
Third screen is the inventory. What can the agent actually do? Built-in tools, connected tool servers, thirty-odd skills, thirty-odd scripts, a handful of standing automations. I maintain this list by hand, because "what can it do" shouldn't be a thing I rediscover.
The column that matters is the one in tokens. Some capabilities are free until used. Others charge rent, sitting in the agent's context at every session start whether the session needs them or not. The screen prices that rent per item and totals it at the top. About fifteen thousand tokens before any work begins.
The top row pays for the whole screen: one network integration costs 2.3 thousand tokens at rest for 197 tools, and I use maybe a handful of the reads. Like paying to garage a semi truck because sometimes you check the mailbox with it. You can't put a capability on a diet until something tells you what it weighs.
Optimizations

The newest screen, and the one that changes what the other three are for. Every so often I run a formal tuning session over the memory system. Measure everything, propose changes by ID, apply only what I approve, re-measure, file a report. One row per run.
Each row links the report the session filed:
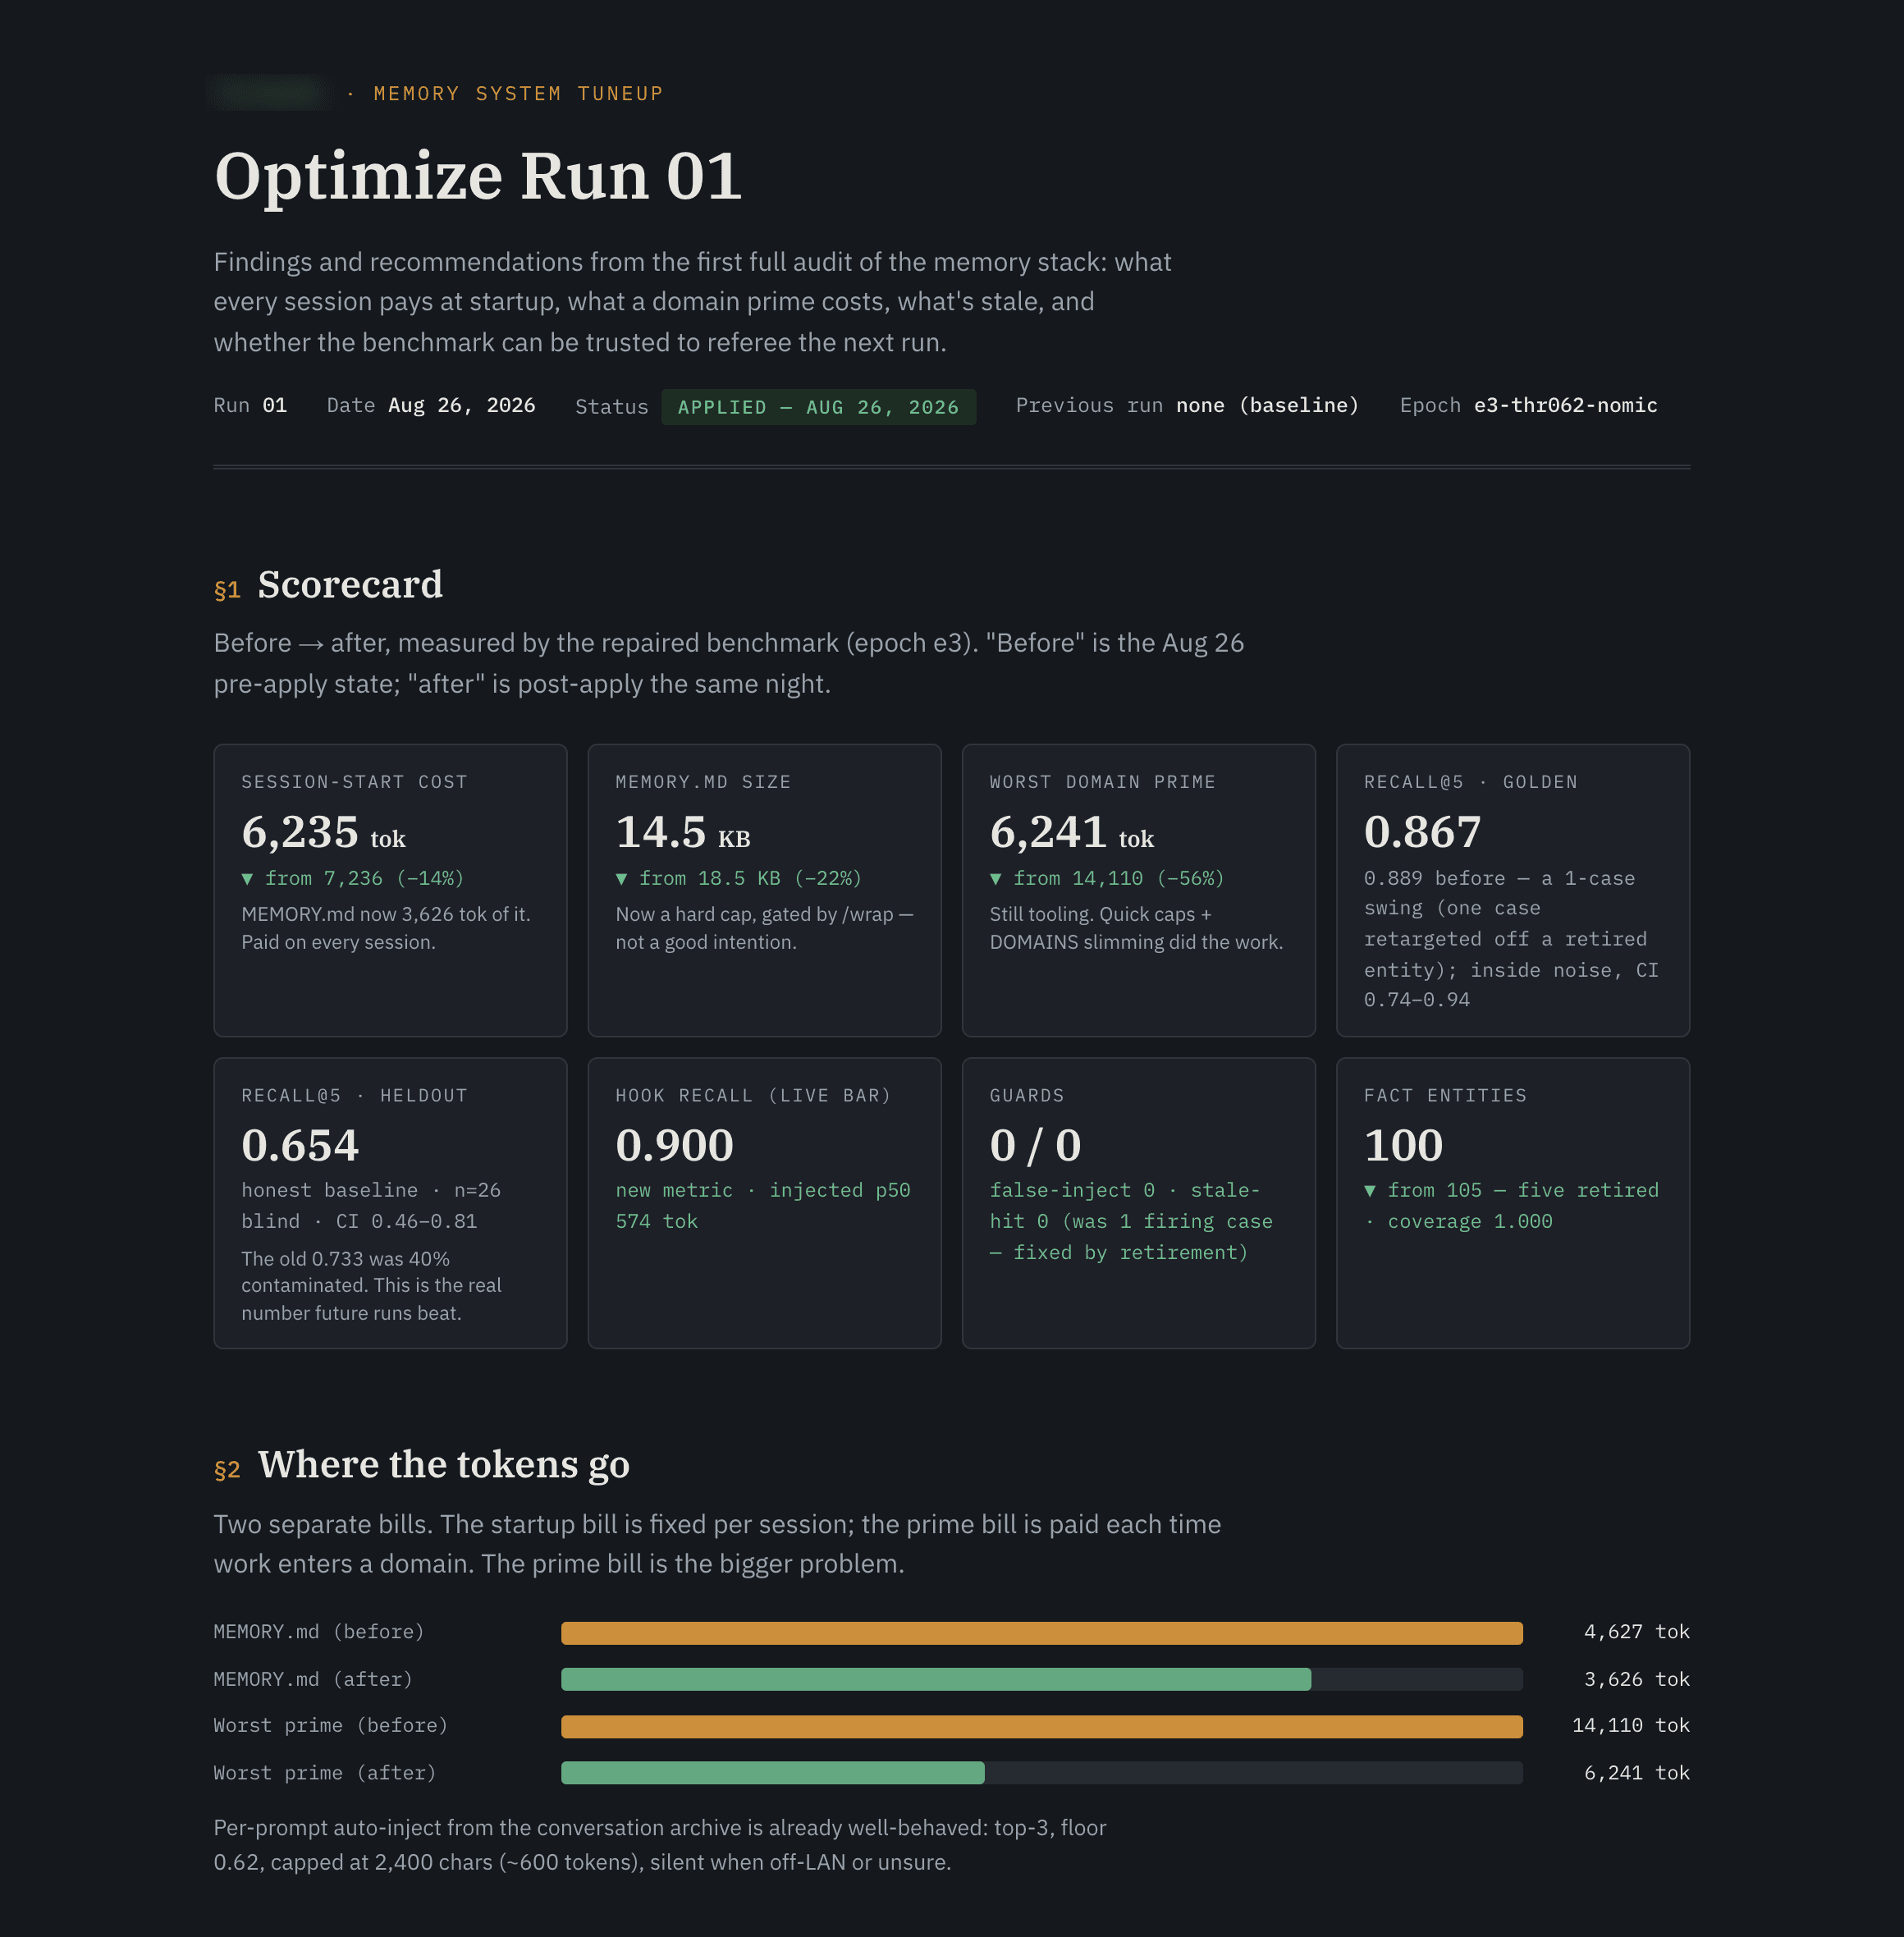
The most important number in that first report is a decline. The held-out benchmark score fell, because the run discovered the held-out question set had been compromised by earlier tuning. It rebuilt the set and took the honest lower score instead of keeping the flattering stale one. A tuning record that only ever shows improvement is advertising. This one got its first chance to be something better and took it.
The pattern
Here's what I didn't see until the screenshots were side by side. Everything on these screens that measures is deliberately dumb. Scripts, schedules, a fixed price table, a fixed question set. No model decides what gets recorded about the model. And everything that changes the system, the grooming cycle and the tuning runs, happens offline between sessions, reading what the dumb layer wrote, landing only when I approve it.
The line matters more than the boxes. The layer that measures is deliberately too boring to be wrong in interesting ways, which is what makes its records worth optimizing against.
Nobody designed that. It accreted one screen at a time out of the rule from the first build log: watch first, act second, and don't let the thing doing the acting keep the score.
Then, while the agent and I were researching the third field report, there it was. The same architecture, pitched to enterprises as a strategy. A deterministic decision layer at runtime, agents above it tuning between runs, a person in the gate. The report measured what the evidence says about it at company scale. Turns out my bench had been running it at household scale the whole time.
That realization wouldn't fit in a build log, so it became the companion note: The clever part goes between runs.